826 Main St Mapleton, IA 51034
Estimated Value: $79,000 - $99,514
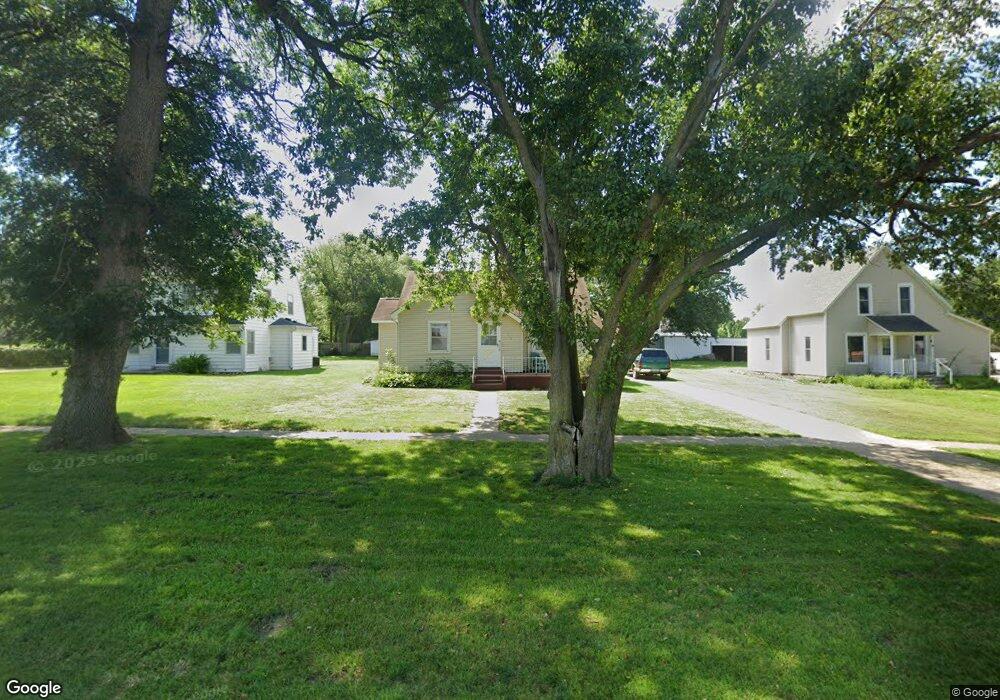
About This Home
This home is located at 826 Main St, Mapleton, IA 51034 and is currently estimated at $89,129, approximately $69 per square foot. 826 Main St is a home located in Monona County with nearby schools including Mapleton Elementary School, Mvao Middle School, and Maple Valley-Anthon Oto High School.
Ownership History
We collect this data history from publicly available records. To have your information removed, we recommend requesting removal directly through your county’s website.
Purchase Details
Home Financials for this Owner
Home Financials are based on the most recent Mortgage that was taken out on this home.Purchase Details
Home Financials for this Owner
Home Financials are based on the most recent Mortgage that was taken out on this home.Purchase Details
Purchase History
We collect this data history from publicly available records. To have your information removed, we recommend requesting removal directly through your county’s website.
| Date | Buyer | Sale Price | Title Company |
|---|---|---|---|
| $80,000 | None Listed On Document | ||
| -- | None Listed On Document | ||
| $50,000 | None Available |
Mortgage History
We collect this data history from publicly available records. To have your information removed, we recommend requesting removal directly through your county’s website.
| Date | Status | Borrower | Loan Amount |
|---|---|---|---|
| Open | $150,000 |
Tax History
We collect this data history from publicly available records. To have your information removed, we recommend requesting removal directly through your county’s website.
| Year | Tax Paid | Tax Assessment Tax Assessment Total Assessment is a certain percentage of the fair market value that is determined by local assessors to be the total taxable value of land and additions on the property. | Land | Improvement |
|---|---|---|---|---|
| 2025 | $1,006 | $67,143 | $11,424 | $55,719 |
| 2024 | $1,014 | $62,768 | $11,424 | $51,344 |
| 2023 | $948 | $49,723 | $0 | $0 |
| 2022 | $742 | $44,581 | $9,450 | $35,131 |
| 2021 | $626 | $44,581 | $9,450 | $35,131 |
| 2020 | $662 | $44,581 | $9,450 | $35,131 |
| 2019 | $662 | $44,654 | $0 | $0 |
| 2018 | $646 | $44,654 | $0 | $0 |
| 2017 | $646 | $42,528 | $0 | $0 |
| 2016 | $628 | $42,528 | $0 | $0 |
| 2015 | $590 | $37,635 | $0 | $0 |
| 2014 | $522 | $37,635 | $0 | $0 |
Map
- 829 Courtright St
- 827 Courtright St
- 833 Courtright St
- 819 Courtright St
- 824 Main St
- 105001 Pecan Ave
- 830 Main St
- 832 Main St
- 803 Courtright St
- 822 1/2 Main St
- 828 Courtright St
- 839 Courtright St
- 832 Courtright St
- 103 Chamberlain Ave
- 834 Courtright St
- 824 Courtright St
- 817 Courtright St
- 820 Main St
- 836 Courtright St
- 818 Main St
Ask me questions while you tour the home.