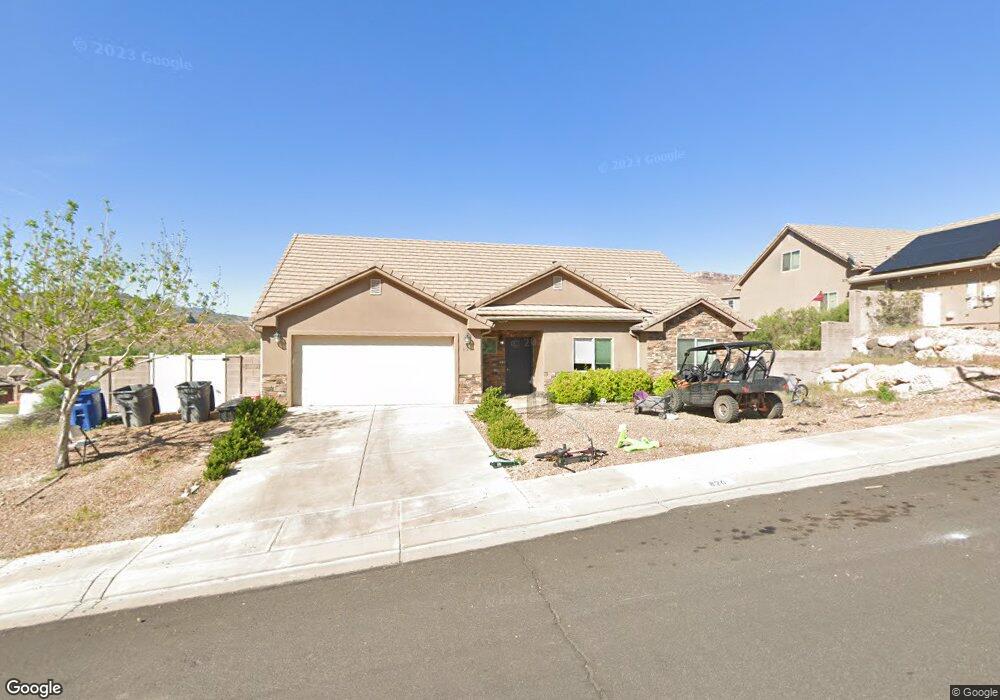
826 N 370 W La Verkin, UT 84745
Estimated Value: $472,000 - $496,000
3
Beds
2
Baths
1,512
Sq Ft
$321/Sq Ft
Est. Value
About This Home
This home is located at 826 N 370 W, La Verkin, UT 84745 and is currently estimated at $485,891, approximately $321 per square foot. 826 N 370 W is a home with nearby schools including La Verkin Elementary School, Hurricane Middle School, and Hurricane High School.
Ownership History
Date
Name
Owned For
Owner Type
Purchase Details
Closed on
Oct 3, 2011
Sold by
Color Country Community Housing Inc
Bought by
Winder Matthew M
Current Estimated Value
Home Financials for this Owner
Home Financials are based on the most recent Mortgage that was taken out on this home.
Original Mortgage
$179,000
Outstanding Balance
$122,026
Interest Rate
4.09%
Mortgage Type
Purchase Money Mortgage
Estimated Equity
$363,865
Purchase Details
Closed on
Jan 30, 2009
Sold by
Five Star Development Inc
Bought by
Zions First National Bank
Purchase Details
Closed on
Jul 31, 2008
Sold by
Five Star Development Inc
Bought by
Color Country Community Housing Inc
Create a Home Valuation Report for This Property
The Home Valuation Report is an in-depth analysis detailing your home's value as well as a comparison with similar homes in the area
Home Values in the Area
Average Home Value in this Area
Purchase History
| Date | Buyer | Sale Price | Title Company |
|---|---|---|---|
| Winder Matthew M | -- | First Amer St George Main | |
| Zions First National Bank | $667,601 | Mountainside Title Insurance | |
| Color Country Community Housing Inc | -- | Terra Title St George Branch |
Source: Public Records
Mortgage History
| Date | Status | Borrower | Loan Amount |
|---|---|---|---|
| Open | Winder Matthew M | $179,000 |
Source: Public Records
Tax History Compared to Growth
Tax History
| Year | Tax Paid | Tax Assessment Tax Assessment Total Assessment is a certain percentage of the fair market value that is determined by local assessors to be the total taxable value of land and additions on the property. | Land | Improvement |
|---|---|---|---|---|
| 2025 | $1,830 | $255,530 | $82,500 | $173,030 |
| 2023 | $1,868 | $247,610 | $77,000 | $170,610 |
| 2022 | $1,852 | $231,165 | $57,750 | $173,415 |
| 2021 | $1,583 | $290,800 | $55,300 | $235,500 |
| 2020 | $1,475 | $253,400 | $49,000 | $204,400 |
| 2019 | $1,315 | $216,600 | $52,000 | $164,600 |
| 2018 | $1,212 | $102,245 | $0 | $0 |
| 2017 | $1,181 | $95,755 | $0 | $0 |
| 2016 | $1,134 | $88,220 | $0 | $0 |
| 2015 | $1,054 | $78,870 | $0 | $0 |
| 2014 | $1,189 | $87,725 | $0 | $0 |
Source: Public Records
Map
Nearby Homes