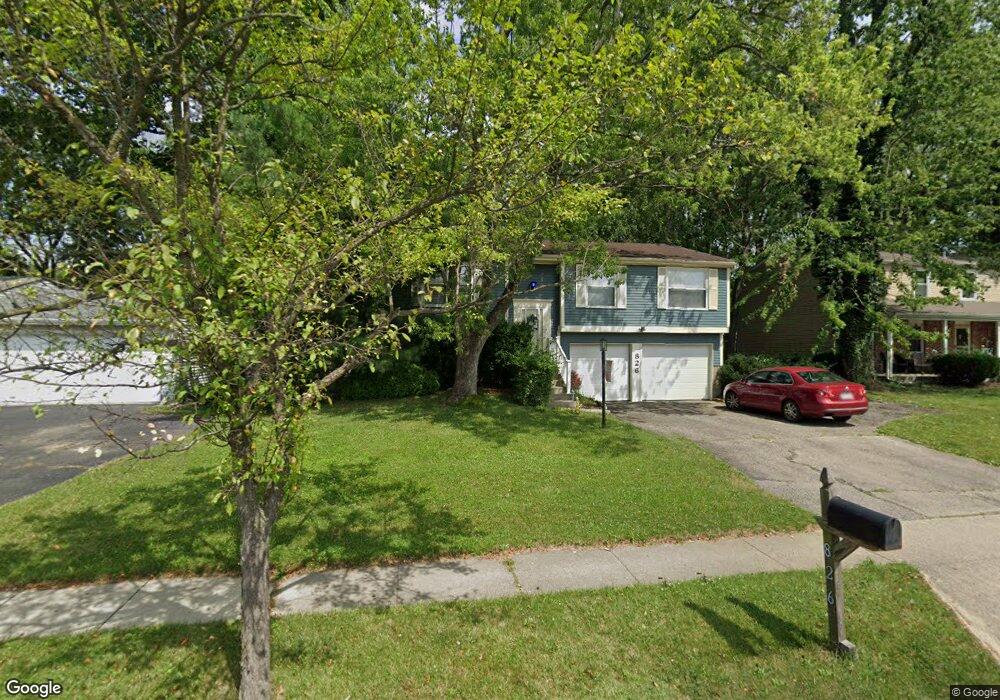
826 N Stygler Rd Columbus, OH 43230
Woodside Green NeighborhoodEstimated Value: $229,000 - $320,000
3
Beds
2
Baths
1,414
Sq Ft
$205/Sq Ft
Est. Value
About This Home
This home is located at 826 N Stygler Rd, Columbus, OH 43230 and is currently estimated at $289,351, approximately $204 per square foot. 826 N Stygler Rd is a home located in Franklin County with nearby schools including Chapelfield Elementary School, Gahanna West Middle School, and Lincoln High School.
Ownership History
Date
Name
Owned For
Owner Type
Purchase Details
Closed on
May 11, 2009
Sold by
Citimortgage Inc
Bought by
Leach Ronald W and Leach Ella M
Current Estimated Value
Purchase Details
Closed on
Jan 28, 2009
Sold by
Milhoan Cindy L and Case #08Cve04 5768
Bought by
Citimortgage Inc
Purchase Details
Closed on
Dec 26, 2003
Sold by
Milhoan Roger L and Milhoan Cindy L
Bought by
Milhoan Cindy L
Home Financials for this Owner
Home Financials are based on the most recent Mortgage that was taken out on this home.
Original Mortgage
$106,000
Interest Rate
7.75%
Mortgage Type
Purchase Money Mortgage
Purchase Details
Closed on
Jun 8, 1992
Bought by
Milhoan Roger L and Milhoan Cindy L
Purchase Details
Closed on
Oct 22, 1987
Purchase Details
Closed on
Jun 1, 1986
Create a Home Valuation Report for This Property
The Home Valuation Report is an in-depth analysis detailing your home's value as well as a comparison with similar homes in the area
Home Values in the Area
Average Home Value in this Area
Purchase History
| Date | Buyer | Sale Price | Title Company |
|---|---|---|---|
| Leach Ronald W | $91,000 | Independent | |
| Citimortgage Inc | $86,000 | None Available | |
| Milhoan Cindy L | -- | Cresent Title Agency Llc | |
| Milhoan Roger L | $82,800 | -- | |
| -- | $75,900 | -- | |
| -- | $70,900 | -- |
Source: Public Records
Mortgage History
| Date | Status | Borrower | Loan Amount |
|---|---|---|---|
| Previous Owner | Milhoan Cindy L | $106,000 |
Source: Public Records
Tax History
| Year | Tax Paid | Tax Assessment Tax Assessment Total Assessment is a certain percentage of the fair market value that is determined by local assessors to be the total taxable value of land and additions on the property. | Land | Improvement |
|---|---|---|---|---|
| 2025 | $5,337 | $88,800 | $27,860 | $60,940 |
| 2024 | $5,337 | $88,800 | $27,860 | $60,940 |
| 2023 | $5,271 | $88,795 | $27,860 | $60,935 |
| 2022 | $4,241 | $55,650 | $14,210 | $41,440 |
| 2021 | $4,105 | $55,650 | $14,210 | $41,440 |
| 2020 | $4,072 | $55,650 | $14,210 | $41,440 |
| 2019 | $3,474 | $47,220 | $11,830 | $35,390 |
| 2018 | $3,290 | $47,220 | $11,830 | $35,390 |
| 2017 | $3,162 | $47,220 | $11,830 | $35,390 |
| 2016 | $3,128 | $42,080 | $14,110 | $27,970 |
| 2015 | $3,130 | $42,080 | $14,110 | $27,970 |
| 2014 | $3,106 | $42,080 | $14,110 | $27,970 |
| 2013 | $1,544 | $42,070 | $14,105 | $27,965 |
Source: Public Records
Map
Nearby Homes
- 830 Lindenhaven Rd
- 956 Crystal Cay Ct
- 586 Pinegrove Place
- 536 Springwood Lake Dr
- 3455 Halpern St
- 108 Walcreek Dr W
- 0 Wendler Blvd
- 4672 Sperry Ave
- 299 Sherwood Meadows Dr
- 464 Foxwood Dr
- 3877 Hines Rd
- 613 Mistletoe St
- 3555 Tami Place
- 475 Denwood Ct
- 439 Canterwood Ct
- 420 Denwood Ct
- 424 Lincolnshire Rd
- 388 Elkwood Place
- 595 Deerwood Ave E
- 167 Greenbank Rd
- 832 N Stygler Rd
- 818 N Stygler Rd
- 819 Mcdonell Dr
- 817 Mcdonell Dr
- 840 N Stygler Rd
- 812 N Stygler Rd
- 821 Mcdonell Dr
- 815 Mcdonell Dr
- 823 Mcdonell Dr
- 4051 N Stygler Rd
- 809 Mcdonell Dr
- 804 N Stygler Rd
- 846 N Stygler Rd
- 4025 N Stygler Rd
- 803 Mcdonell Dr
- 798 N Stygler Rd
- 854 N Stygler Rd
- 4061 N Stygler Rd
- 818 Mcdonell Dr
- 820 Mcdonell Dr
Your Personal Tour Guide
Ask me questions while you tour the home.