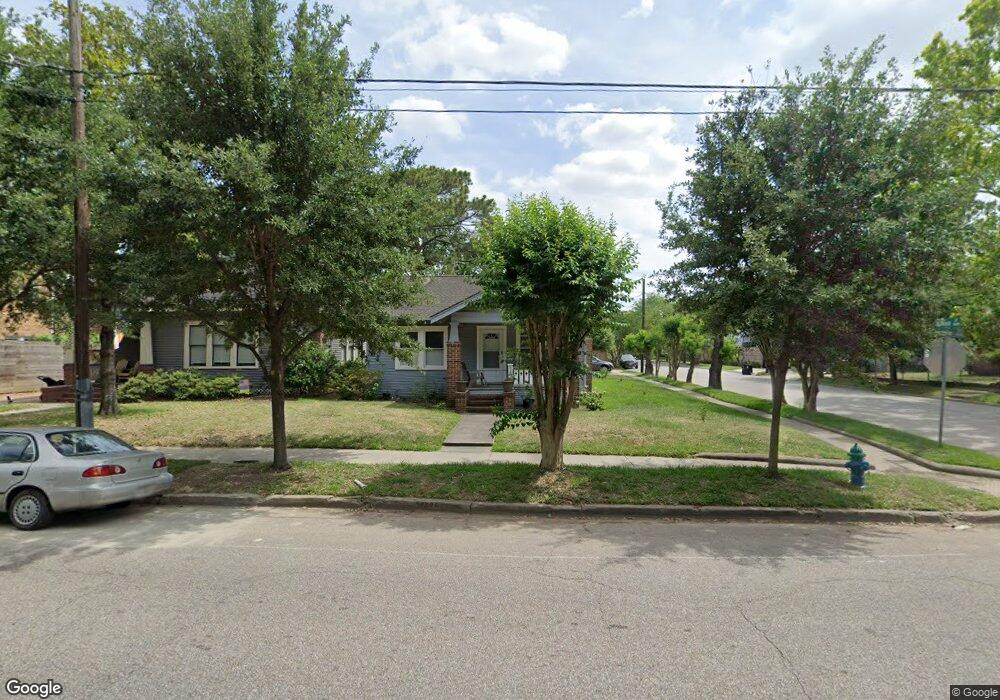
826 Pecore St Houston, TX 77009
Greater Heights NeighborhoodEstimated Value: $488,000 - $609,412
2
Beds
1
Bath
1,176
Sq Ft
$485/Sq Ft
Est. Value
About This Home
This home is located at 826 Pecore St, Houston, TX 77009 and is currently estimated at $570,603, approximately $485 per square foot. 826 Pecore St is a home located in Harris County with nearby schools including Travis Elementary School, Hogg Middle, and Heights High School.
Ownership History
Date
Name
Owned For
Owner Type
Purchase Details
Closed on
Feb 16, 2012
Sold by
Ramos Samuel
Bought by
Ramos Aurora
Current Estimated Value
Home Financials for this Owner
Home Financials are based on the most recent Mortgage that was taken out on this home.
Original Mortgage
$110,000
Interest Rate
3.93%
Mortgage Type
Seller Take Back
Purchase Details
Closed on
Dec 8, 2010
Sold by
Ramos Samuel
Bought by
Ramos Aurora Rodriguez
Purchase Details
Closed on
Feb 12, 1996
Sold by
Texas Gulf Coast Investments Inc
Bought by
Ramos Samuel
Home Financials for this Owner
Home Financials are based on the most recent Mortgage that was taken out on this home.
Original Mortgage
$26,100
Interest Rate
7.09%
Mortgage Type
Seller Take Back
Create a Home Valuation Report for This Property
The Home Valuation Report is an in-depth analysis detailing your home's value as well as a comparison with similar homes in the area
Home Values in the Area
Average Home Value in this Area
Purchase History
| Date | Buyer | Sale Price | Title Company |
|---|---|---|---|
| Ramos Aurora | -- | None Available | |
| Ramos Aurora Rodriguez | -- | None Available | |
| Ramos Samuel | -- | Title Agency #26 |
Source: Public Records
Mortgage History
| Date | Status | Borrower | Loan Amount |
|---|---|---|---|
| Closed | Ramos Aurora | $110,000 | |
| Closed | Ramos Samuel | $26,100 |
Source: Public Records
Tax History Compared to Growth
Tax History
| Year | Tax Paid | Tax Assessment Tax Assessment Total Assessment is a certain percentage of the fair market value that is determined by local assessors to be the total taxable value of land and additions on the property. | Land | Improvement |
|---|---|---|---|---|
| 2025 | $4,199 | $569,225 | $500,000 | $69,225 |
| 2024 | $4,199 | $556,912 | $500,000 | $56,912 |
| 2023 | $4,199 | $507,939 | $450,000 | $57,939 |
| 2022 | $10,274 | $466,596 | $415,000 | $51,596 |
| 2021 | $10,435 | $447,748 | $400,000 | $47,748 |
| 2020 | $10,435 | $430,927 | $400,000 | $30,927 |
| 2019 | $11,178 | $441,721 | $400,000 | $41,721 |
| 2018 | $11,420 | $451,287 | $400,000 | $51,287 |
| 2017 | $11,411 | $451,287 | $400,000 | $51,287 |
| 2016 | $10,338 | $408,862 | $360,000 | $48,862 |
| 2015 | $8,884 | $386,362 | $337,500 | $48,862 |
| 2014 | $8,884 | $345,575 | $303,750 | $41,825 |
Source: Public Records
Map
Nearby Homes
- 825 Merrill St
- 838 Key St
- 920 Key St
- 931 Merrill St
- 1032 Key St
- 3541 Michaux St
- 1011 W Cottage St
- 606 Merrill St
- 909 Bayland Ave
- 922 Bayland Ave
- 1033 Highland St
- 4008 Norhill Blvd
- 1114 W Cottage St
- 424 Redan St
- 301 Tabor St
- 423 Pecore St
- 209 Walton St
- 4129 De George St
- 410 Merrill St
- 4127 De George St