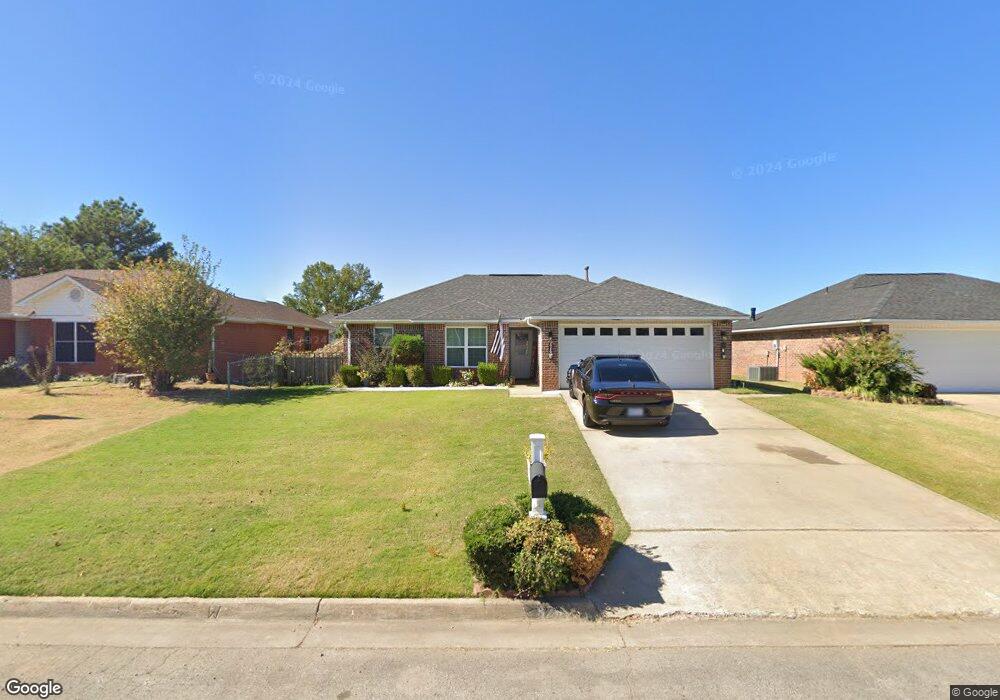
826 S 39th St van Buren, AR 72956
Estimated Value: $168,000 - $187,000
--
Bed
2
Baths
1,203
Sq Ft
$147/Sq Ft
Est. Value
About This Home
This home is located at 826 S 39th St, van Buren, AR 72956 and is currently estimated at $176,301, approximately $146 per square foot. 826 S 39th St is a home located in Crawford County with nearby schools including King Elementary School, Butterfield Trail Middle School, and Van Buren High School.
Ownership History
Date
Name
Owned For
Owner Type
Purchase Details
Closed on
Jun 7, 2023
Sold by
Barlee Properties Ii Limited Partnership
Bought by
Sequoyah Homes Llc and Wines Holdings Arkansas Llc
Current Estimated Value
Purchase Details
Closed on
Feb 26, 2009
Sold by
English Elizabeth O
Bought by
Guerra Rafael A and Guerra Ariana
Home Financials for this Owner
Home Financials are based on the most recent Mortgage that was taken out on this home.
Original Mortgage
$87,142
Outstanding Balance
$55,173
Interest Rate
5.13%
Mortgage Type
New Conventional
Estimated Equity
$121,128
Purchase Details
Closed on
Jun 19, 2002
Bought by
Hud-English
Purchase Details
Closed on
Jan 23, 2002
Bought by
Hud and Principal
Purchase Details
Closed on
Dec 31, 2001
Bought by
Thongprachanh-Principal
Purchase Details
Closed on
Jan 2, 1997
Bought by
Rogers-Thongprachanh
Purchase Details
Closed on
Mar 15, 1996
Bought by
Young-Rogers
Create a Home Valuation Report for This Property
The Home Valuation Report is an in-depth analysis detailing your home's value as well as a comparison with similar homes in the area
Home Values in the Area
Average Home Value in this Area
Purchase History
| Date | Buyer | Sale Price | Title Company |
|---|---|---|---|
| Sequoyah Homes Llc | $1,095,500 | -- | |
| Guerra Rafael A | $86,000 | -- | |
| Hud-English | -- | -- | |
| Hud | -- | -- | |
| Thongprachanh-Principal | -- | -- | |
| Rogers-Thongprachanh | $59,000 | -- | |
| Young-Rogers | $9,000 | -- |
Source: Public Records
Mortgage History
| Date | Status | Borrower | Loan Amount |
|---|---|---|---|
| Open | Guerra Rafael A | $87,142 |
Source: Public Records
Tax History Compared to Growth
Tax History
| Year | Tax Paid | Tax Assessment Tax Assessment Total Assessment is a certain percentage of the fair market value that is determined by local assessors to be the total taxable value of land and additions on the property. | Land | Improvement |
|---|---|---|---|---|
| 2025 | $331 | $29,180 | $2,000 | $27,180 |
| 2024 | $390 | $29,180 | $2,000 | $27,180 |
| 2023 | $425 | $29,180 | $2,000 | $27,180 |
| 2022 | $434 | $15,590 | $2,000 | $13,590 |
| 2021 | $434 | $15,590 | $2,000 | $13,590 |
| 2020 | $434 | $15,590 | $2,000 | $13,590 |
| 2019 | $434 | $15,590 | $2,000 | $13,590 |
| 2018 | $459 | $15,590 | $2,000 | $13,590 |
| 2017 | $503 | $16,440 | $2,000 | $14,440 |
| 2016 | $503 | $16,440 | $2,000 | $14,440 |
| 2015 | $454 | $16,440 | $2,000 | $14,440 |
| 2014 | $454 | $16,440 | $2,000 | $14,440 |
Source: Public Records
Map
Nearby Homes