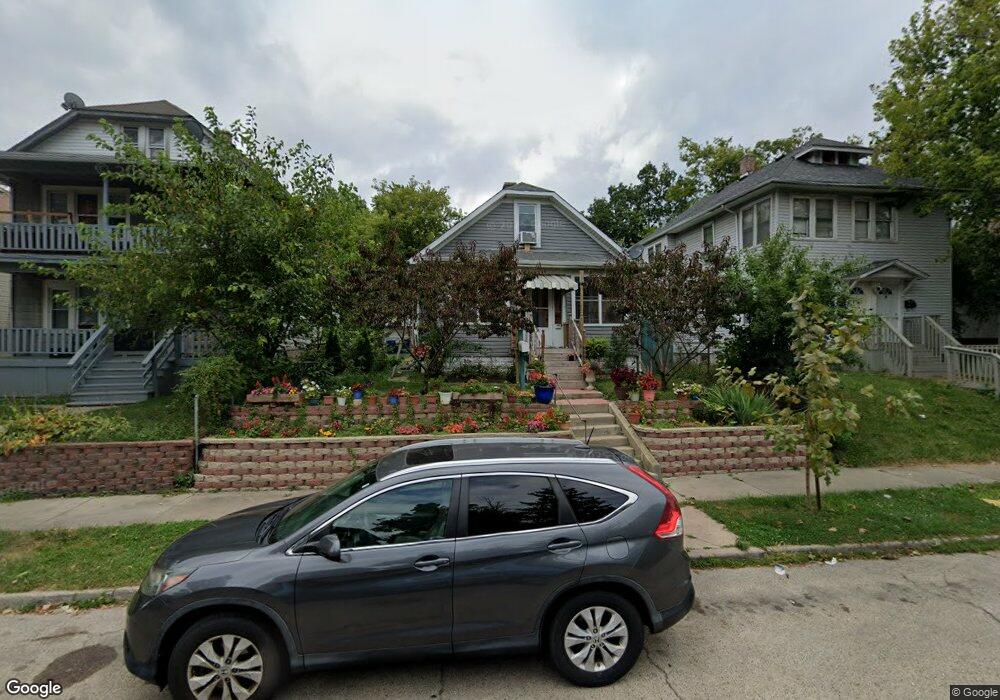
826 S Ml King jr Ave Waukegan, IL 60085
Estimated Value: $142,000 - $214,000
3
Beds
1
Bath
1,388
Sq Ft
$129/Sq Ft
Est. Value
About This Home
This home is located at 826 S Ml King jr Ave, Waukegan, IL 60085 and is currently estimated at $179,061, approximately $129 per square foot. 826 S Ml King jr Ave is a home located in Lake County with nearby schools including Carman-Buckner Elementary School, John R Lewis Middle School, and Waukegan High School.
Ownership History
Date
Name
Owned For
Owner Type
Purchase Details
Closed on
Aug 1, 2018
Sold by
Hosanna Hipolita
Bought by
Contreras Severo
Current Estimated Value
Home Financials for this Owner
Home Financials are based on the most recent Mortgage that was taken out on this home.
Original Mortgage
$87,584
Interest Rate
5.25%
Mortgage Type
FHA
Purchase Details
Closed on
Nov 5, 2014
Sold by
Mendoza Gladis
Bought by
Hosanna Hipolita
Purchase Details
Closed on
Sep 26, 2014
Sold by
Secretary Of Housing & Urban Development
Bought by
Mendoza Gladis
Purchase Details
Closed on
Apr 1, 2014
Sold by
Lane Maggie and Phh Mortgage Corporation
Bought by
Secretary Of Housing & Urban Development
Create a Home Valuation Report for This Property
The Home Valuation Report is an in-depth analysis detailing your home's value as well as a comparison with similar homes in the area
Home Values in the Area
Average Home Value in this Area
Purchase History
| Date | Buyer | Sale Price | Title Company |
|---|---|---|---|
| Contreras Severo | $89,200 | Attorneys Title Guaranty Fun | |
| Hosanna Hipolita | -- | Chicago Title Insurance Co | |
| Mendoza Gladis | -- | Acquest Title Services Llc | |
| Secretary Of Housing & Urban Development | $83,939 | None Available |
Source: Public Records
Mortgage History
| Date | Status | Borrower | Loan Amount |
|---|---|---|---|
| Previous Owner | Contreras Severo | $87,584 |
Source: Public Records
Tax History Compared to Growth
Tax History
| Year | Tax Paid | Tax Assessment Tax Assessment Total Assessment is a certain percentage of the fair market value that is determined by local assessors to be the total taxable value of land and additions on the property. | Land | Improvement |
|---|---|---|---|---|
| 2024 | $3,014 | $44,642 | $6,867 | $37,775 |
| 2023 | $2,455 | $39,968 | $6,148 | $33,820 |
| 2022 | $2,455 | $31,110 | $4,785 | $26,325 |
| 2021 | $2,158 | $26,699 | $4,167 | $22,532 |
| 2020 | $1,931 | $23,034 | $3,887 | $19,147 |
| 2019 | $1,891 | $21,107 | $3,562 | $17,545 |
| 2018 | $900 | $13,339 | $2,911 | $10,428 |
| 2017 | $825 | $11,801 | $2,575 | $9,226 |
| 2016 | $1,337 | $14,650 | $3,198 | $11,452 |
| 2015 | $1,201 | $13,112 | $2,862 | $10,250 |
| 2014 | $1,945 | $17,425 | $2,655 | $14,770 |
| 2012 | $2,085 | $18,879 | $2,877 | $16,002 |
Source: Public Records
Map
Nearby Homes
- 924 Lenox Ave
- 710 S Martin Luther King Junior Ave
- 842 Wadsworth Ave
- 515 May St
- 631 8th St
- 815 Prescott St
- 724 10th St
- 1102 Wadsworth Ave
- 1101 Adams St
- 600 Sunderlin St
- 547 S Martin Luther King Junior Ave
- 1210 Park Ave
- 720 13th St
- 1244 Victoria Ave
- 502 Belvidere Rd
- 408 Besley Place
- 305 Besley Place
- 1223 Greenfield Ave
- 446 S Jackson St
- 613 Clarke Ave
- 826 S Martin Luther King jr Ave
- 822 S Ml King jr Ave
- 828 S Ml King jr Ave
- 822 S Martin Luther King Junior Ave
- 828 S Martin Luther King jr Ave
- 820 S Ml King jr Ave
- 832 S Ml King jr Ave
- 820 S Martin Luther King jr Ave
- 816 S Ml King jr Ave
- 825 Lenox Ave
- 831 Lenox Ave
- 814 S Ml King jr Ave
- 838 S Ml King jr Ave
- 814 S Martin Luther King jr Ave
- 814 S Martin Luther King Junior Ave
- 838 S Martin Luther King Junior Ave
- 833 Lenox Ave
- 831 S Martin Luther King Junior Ave
- 831 S Martin Luther King jr Ave
- 831 S Ml King jr Ave