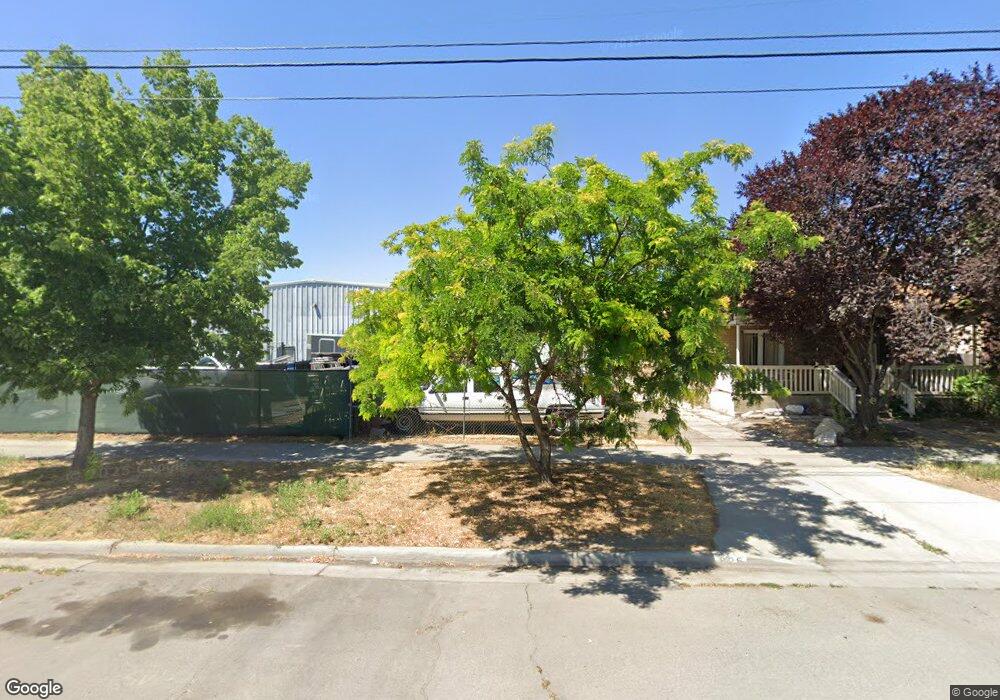
826 W 100 S Salt Lake City, UT 84104
Poplar Grove NeighborhoodEstimated Value: $301,000 - $352,000
2
Beds
1
Bath
1,036
Sq Ft
$324/Sq Ft
Est. Value
About This Home
This home is located at 826 W 100 S, Salt Lake City, UT 84104 and is currently estimated at $335,974, approximately $324 per square foot. 826 W 100 S is a home located in Salt Lake County with nearby schools including Franklin Elementary School, East High School, and Madeleine Choir School.
Ownership History
Date
Name
Owned For
Owner Type
Purchase Details
Closed on
Feb 25, 2000
Sold by
Gerber John S
Bought by
Boyer Craig L and Boyer Jalene
Current Estimated Value
Home Financials for this Owner
Home Financials are based on the most recent Mortgage that was taken out on this home.
Original Mortgage
$42,000
Outstanding Balance
$14,101
Interest Rate
8.16%
Estimated Equity
$321,873
Create a Home Valuation Report for This Property
The Home Valuation Report is an in-depth analysis detailing your home's value as well as a comparison with similar homes in the area
Home Values in the Area
Average Home Value in this Area
Purchase History
| Date | Buyer | Sale Price | Title Company |
|---|---|---|---|
| Boyer Craig L | -- | Meridian Title |
Source: Public Records
Mortgage History
| Date | Status | Borrower | Loan Amount |
|---|---|---|---|
| Open | Boyer Craig L | $42,000 |
Source: Public Records
Tax History Compared to Growth
Tax History
| Year | Tax Paid | Tax Assessment Tax Assessment Total Assessment is a certain percentage of the fair market value that is determined by local assessors to be the total taxable value of land and additions on the property. | Land | Improvement |
|---|---|---|---|---|
| 2025 | $971 | $194,800 | $95,300 | $99,500 |
| 2024 | $971 | $185,200 | $90,200 | $95,000 |
| 2023 | $906 | $166,600 | $86,700 | $79,900 |
| 2022 | $1,000 | $172,600 | $85,000 | $87,600 |
| 2021 | $908 | $141,900 | $52,400 | $89,500 |
| 2020 | $896 | $133,300 | $46,800 | $86,500 |
| 2019 | $923 | $129,100 | $44,500 | $84,600 |
| 2018 | $722 | $98,300 | $42,200 | $56,100 |
| 2017 | $755 | $96,400 | $42,200 | $54,200 |
| 2016 | $715 | $86,600 | $35,500 | $51,100 |
| 2015 | $620 | $71,200 | $32,700 | $38,500 |
| 2014 | $571 | $65,100 | $32,000 | $33,100 |
Source: Public Records
Map
Nearby Homes