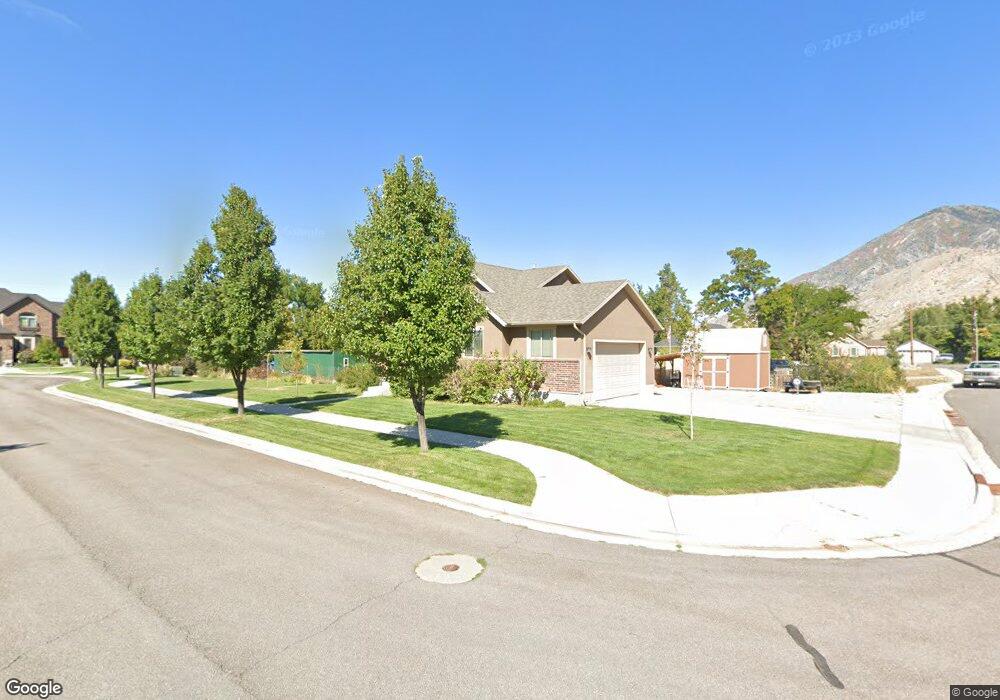
826 W 1900 N Mapleton, UT 84664
Estimated Value: $586,000 - $690,000
2
Beds
2
Baths
2,347
Sq Ft
$265/Sq Ft
Est. Value
About This Home
This home is located at 826 W 1900 N, Mapleton, UT 84664 and is currently estimated at $621,031, approximately $264 per square foot. 826 W 1900 N is a home located in Utah County with nearby schools including Mapleton School, Mapleton Junior High School, and Maple Mountain High School.
Ownership History
Date
Name
Owned For
Owner Type
Purchase Details
Closed on
Apr 9, 2016
Sold by
Backus Michael Brady and Skinner Sharalyn Alesa
Bought by
Backus Michael Brady and Backus Sharalyn Alesa Skinner
Current Estimated Value
Purchase Details
Closed on
Jan 19, 2016
Sold by
Backus Michael Brady
Bought by
Backus Michael Brady and Skinner Sharalyn Alesa
Home Financials for this Owner
Home Financials are based on the most recent Mortgage that was taken out on this home.
Original Mortgage
$240,350
Outstanding Balance
$190,779
Interest Rate
3.9%
Mortgage Type
New Conventional
Estimated Equity
$430,252
Purchase Details
Closed on
Jun 19, 2012
Sold by
Hawks Thomas S and Sorensen Shiloh H
Bought by
Sorensen Justin Michael and Sorensen Cassie Lynn
Home Financials for this Owner
Home Financials are based on the most recent Mortgage that was taken out on this home.
Original Mortgage
$1,924,945
Outstanding Balance
$1,330,294
Interest Rate
3.77%
Mortgage Type
Construction
Estimated Equity
-$709,263
Create a Home Valuation Report for This Property
The Home Valuation Report is an in-depth analysis detailing your home's value as well as a comparison with similar homes in the area
Home Values in the Area
Average Home Value in this Area
Purchase History
| Date | Buyer | Sale Price | Title Company |
|---|---|---|---|
| Backus Michael Brady | -- | Gt Title Services Salt Lake | |
| Backus Michael Brady | -- | Gt Title Services | |
| Sorensen Justin Michael | -- | None Available |
Source: Public Records
Mortgage History
| Date | Status | Borrower | Loan Amount |
|---|---|---|---|
| Open | Backus Michael Brady | $240,350 | |
| Open | Sorensen Justin Michael | $1,924,945 |
Source: Public Records
Tax History
| Year | Tax Paid | Tax Assessment Tax Assessment Total Assessment is a certain percentage of the fair market value that is determined by local assessors to be the total taxable value of land and additions on the property. | Land | Improvement |
|---|---|---|---|---|
| 2025 | $2,787 | $300,465 | -- | -- |
| 2024 | $2,787 | $273,020 | $0 | $0 |
| 2023 | $2,827 | $278,685 | $0 | $0 |
| 2022 | $3,042 | $296,505 | $0 | $0 |
| 2021 | $2,521 | $377,300 | $162,200 | $215,100 |
| 2020 | $2,477 | $358,600 | $143,500 | $215,100 |
| 2019 | $2,197 | $324,700 | $137,700 | $187,000 |
| 2018 | $2,043 | $287,400 | $116,000 | $171,400 |
| 2017 | $1,980 | $147,785 | $0 | $0 |
| 2016 | $1,938 | $143,825 | $0 | $0 |
| 2015 | $2,044 | $150,755 | $0 | $0 |
| 2014 | $1,873 | $135,630 | $0 | $0 |
Source: Public Records
Map
Nearby Homes
- 1121 W 1800 N
- 1697 N 500 W
- 598 W 1600 N
- 949 S 1060 E
- 145 W Carnesecca Ct
- 1518 E Pheasant Run Dr
- 1618 E 970 S
- 405 W 1200 N Unit 4
- 487 W 1200 N Unit 1
- 1403 S 625 E
- 1225 N 1380 W
- 1410 W 1200 N
- 1518 S 600 E
- 883 E 700 S
- 66 E 750 S Unit 23
- 1350 N Main St
- 1839 River Bottom Rd
- 677 E 800 South St
- 1525 S 400 E Unit 36
- 557 S 1470 E
Your Personal Tour Guide
Ask me questions while you tour the home.