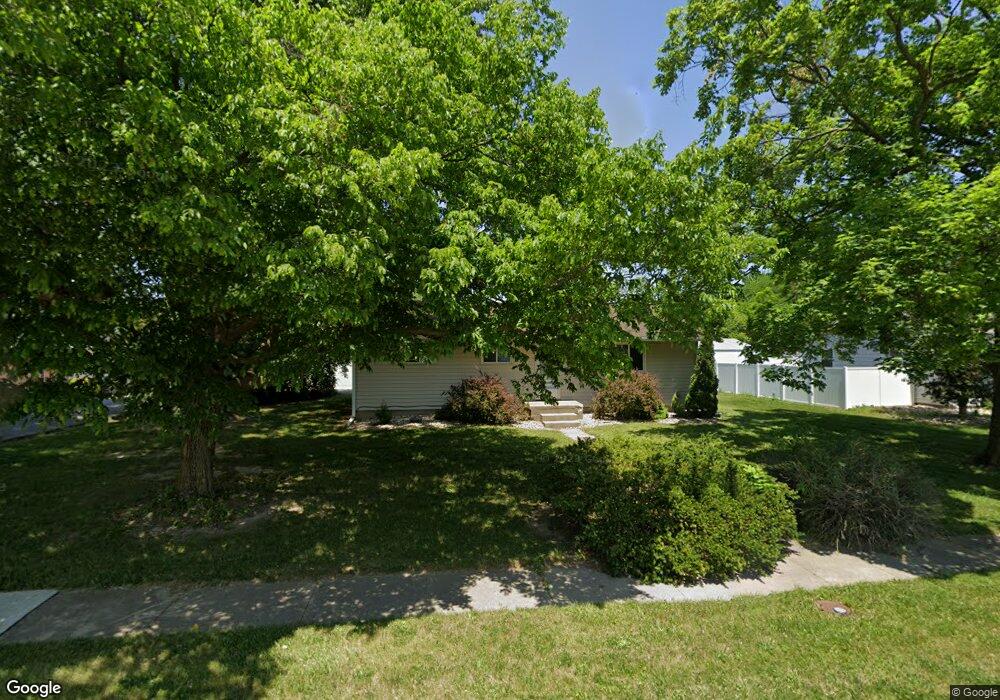
826 W Main St Thorntown, IN 46071
Estimated Value: $138,000 - $242,000
3
Beds
1
Bath
1,000
Sq Ft
$177/Sq Ft
Est. Value
About This Home
This home is located at 826 W Main St, Thorntown, IN 46071 and is currently estimated at $177,474, approximately $177 per square foot. 826 W Main St is a home located in Boone County with nearby schools including Western Boone Junior/Senior High School.
Ownership History
Date
Name
Owned For
Owner Type
Purchase Details
Closed on
Jan 12, 2012
Sold by
Threlkeld Dennis E
Bought by
Harlos Max M
Current Estimated Value
Home Financials for this Owner
Home Financials are based on the most recent Mortgage that was taken out on this home.
Original Mortgage
$58,500
Outstanding Balance
$39,960
Interest Rate
3.98%
Mortgage Type
New Conventional
Estimated Equity
$137,514
Purchase Details
Closed on
Nov 18, 2009
Sold by
Bryan Mark R and Bryan Tammy Gillan
Bought by
Threlkeld Dennis E
Create a Home Valuation Report for This Property
The Home Valuation Report is an in-depth analysis detailing your home's value as well as a comparison with similar homes in the area
Home Values in the Area
Average Home Value in this Area
Purchase History
| Date | Buyer | Sale Price | Title Company |
|---|---|---|---|
| Harlos Max M | -- | Meridian Title | |
| Threlkeld Dennis E | -- | -- |
Source: Public Records
Mortgage History
| Date | Status | Borrower | Loan Amount |
|---|---|---|---|
| Open | Harlos Max M | $58,500 |
Source: Public Records
Tax History Compared to Growth
Tax History
| Year | Tax Paid | Tax Assessment Tax Assessment Total Assessment is a certain percentage of the fair market value that is determined by local assessors to be the total taxable value of land and additions on the property. | Land | Improvement |
|---|---|---|---|---|
| 2025 | $770 | $130,800 | $16,800 | $114,000 |
| 2024 | $770 | $122,400 | $16,800 | $105,600 |
| 2023 | $687 | $113,200 | $16,800 | $96,400 |
| 2022 | $710 | $106,800 | $16,600 | $90,200 |
| 2021 | $532 | $92,400 | $16,600 | $75,800 |
| 2020 | $496 | $89,100 | $16,600 | $72,500 |
| 2019 | $459 | $86,800 | $16,600 | $70,200 |
| 2018 | $412 | $83,300 | $16,600 | $66,700 |
| 2017 | $348 | $78,600 | $16,600 | $62,000 |
| 2016 | $287 | $74,000 | $16,600 | $57,400 |
| 2014 | $260 | $68,400 | $16,600 | $51,800 |
| 2013 | $277 | $68,400 | $16,600 | $51,800 |
Source: Public Records
Map
Nearby Homes
- 1323 Locust Place
- 223 S West St
- 1321 Locust Place
- 117 N Market St
- Ironwood Plan at Northwood Haven
- Spruce Plan at Northwood Haven
- Ashton Plan at Northwood Haven
- Palmetto Plan at Northwood Haven
- Bradford Plan at Northwood Haven
- Aspen II Plan at Northwood Haven
- Empress Plan at Northwood Haven
- Juniper Plan at Northwood Haven
- Chestnut Plan at Northwood Haven
- Norway Plan at Northwood Haven
- Cooper Plan at Northwood Haven
- 6139 Westfall Dr
- Juniper Plan at Westfall Place
- Chestnut Plan at Westfall Place
- Walnut Plan at Westfall Place
- Ironwood Plan at Westfall Place