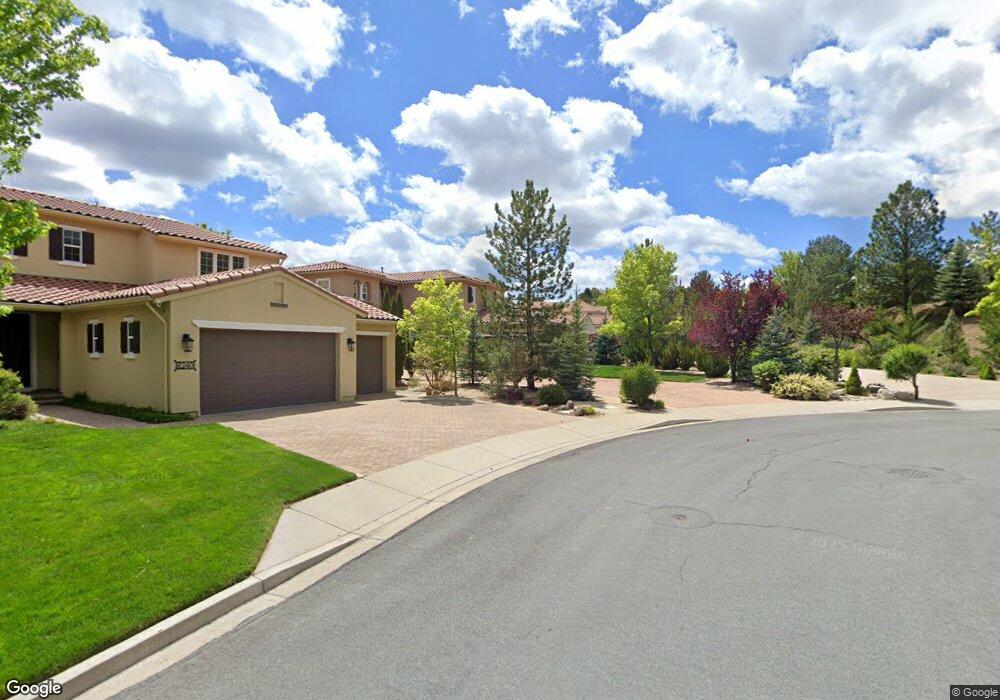
8260 Antler Pointe Ct Reno, NV 89523
Somersett NeighborhoodEstimated Value: $961,000 - $1,153,481
3
Beds
3
Baths
2,593
Sq Ft
$414/Sq Ft
Est. Value
About This Home
This home is located at 8260 Antler Pointe Ct, Reno, NV 89523 and is currently estimated at $1,072,370, approximately $413 per square foot. 8260 Antler Pointe Ct is a home located in Washoe County with nearby schools including B D Billinghurst Middle School, Robert McQueen High School, and Riverview Christian Academy.
Ownership History
Date
Name
Owned For
Owner Type
Purchase Details
Closed on
May 7, 2019
Sold by
Talley Patricia R and Erne Gisela G
Bought by
Gross Talley Patricia Rae and Gross Erne Gisela
Current Estimated Value
Purchase Details
Closed on
Jun 25, 2010
Sold by
Hansen Bryan and Hansen Naoita
Bought by
Talley Patricia R and Erne Gisela G
Purchase Details
Closed on
Oct 8, 2004
Sold by
Pmg Golf Communities Llc
Bought by
Hansen Bryan and Hansen Naoita
Home Financials for this Owner
Home Financials are based on the most recent Mortgage that was taken out on this home.
Original Mortgage
$435,627
Interest Rate
6.62%
Mortgage Type
Unknown
Create a Home Valuation Report for This Property
The Home Valuation Report is an in-depth analysis detailing your home's value as well as a comparison with similar homes in the area
Home Values in the Area
Average Home Value in this Area
Purchase History
| Date | Buyer | Sale Price | Title Company |
|---|---|---|---|
| Gross Talley Patricia Rae | -- | None Available | |
| Talley Patricia R | $325,000 | Ticor Title Reno | |
| Hansen Bryan | $545,000 | Ticor Title Of Nevada Inc |
Source: Public Records
Mortgage History
| Date | Status | Borrower | Loan Amount |
|---|---|---|---|
| Previous Owner | Hansen Bryan | $435,627 | |
| Closed | Hansen Bryan | $81,680 |
Source: Public Records
Tax History
| Year | Tax Paid | Tax Assessment Tax Assessment Total Assessment is a certain percentage of the fair market value that is determined by local assessors to be the total taxable value of land and additions on the property. | Land | Improvement |
|---|---|---|---|---|
| 2026 | -- | $264,634 | $105,525 | $159,109 |
| 2024 | $5,799 | $253,217 | $90,843 | $162,375 |
| 2023 | $5,630 | $246,717 | $93,126 | $153,591 |
| 2022 | $5,467 | $202,329 | $74,501 | $127,828 |
| 2021 | $5,308 | $182,356 | $55,267 | $127,089 |
| 2020 | $5,151 | $190,024 | $62,829 | $127,195 |
| 2019 | $5,001 | $183,968 | $61,052 | $122,916 |
| 2018 | $4,796 | $167,845 | $49,228 | $118,617 |
| 2017 | $4,658 | $163,175 | $44,559 | $118,616 |
| 2016 | $4,540 | $155,768 | $34,566 | $121,202 |
| 2015 | $1,138 | $153,524 | $31,838 | $121,686 |
| 2014 | $4,399 | $137,894 | $32,074 | $105,820 |
| 2013 | -- | $116,518 | $24,231 | $92,287 |
Source: Public Records
Map
Nearby Homes
- 8360 Cinnamon Ridge Ln
- 2195 Candle Rock Ct
- 2305 Eagle Bend Trail
- 2595 Drake Wood Ct
- 2250 Eagle Bend Ct
- 8175 Twin Eagles Ct
- 2370 Eagle Bend Trail
- 2395 Eagle Bend Trail
- 1940 Morning Grove Ct
- 8195 Fox Meadows Ct
- 2440 Mountain Spirit Trail
- 8601 Eagle Chase Trail
- 1660 Boulder Ridge Ct
- 8674 Eagle Chase Trail
- 7790 Town Square Way
- 8770 Lost Creek Ct
- 1593 River Hill Way
- 1601 River Hill Way
- 1655 Scott Valley Rd
- 1530 River Hill Way
- 8250 Antler Pointe Ct
- 8240 Antler Pointe Ct
- 8230 Antler Pointe Ct
- 8245 Antler Pointe Ct
- 8199 Sierra Ridge Ct
- 8220 Antler Pointe Ct
- 8195 Sierra Ridge Ct
- 8210 Antler Pointe Ct
- 8191 Sierra Ridge Ct
- 8235 Antler Pointe Ct
- 8198 Sierra Ridge Ct
- 8187 Sierra Ridge Ct
- 8225 Antler Pointe Ct
- 8190 Sierra Ridge Ct
- 8183 Sierra Ridge Ct
- 0 Painted River Trail Unit 90014622
- 0 Painted River Trail Unit 100009726
- 0 Painted River Trail Unit 100009724
- 0 Painted River Trail Unit 3K-3 100012262
- 0 Painted River Trail Unit 100012261
Your Personal Tour Guide
Ask me questions while you tour the home.