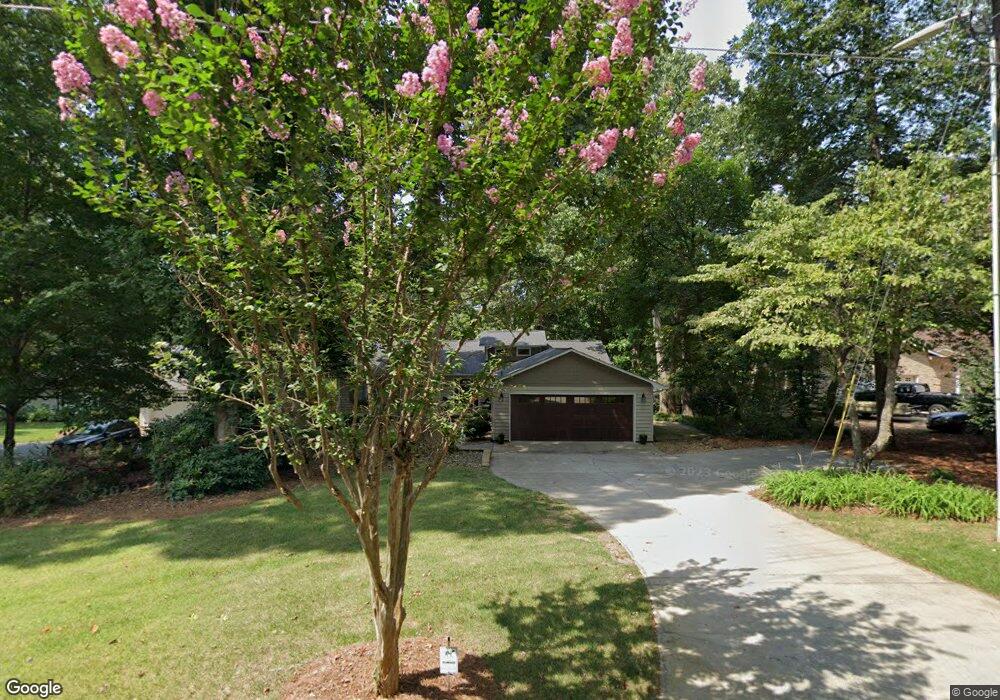
8268 Blades Trail Denver, NC 28037
Estimated Value: $1,132,000 - $1,259,000
5
Beds
4
Baths
3,692
Sq Ft
$323/Sq Ft
Est. Value
About This Home
This home is located at 8268 Blades Trail, Denver, NC 28037 and is currently estimated at $1,191,173, approximately $322 per square foot. 8268 Blades Trail is a home located in Lincoln County with nearby schools including Rock Springs Elementary School, North Lincoln Middle School, and North Lincoln High School.
Ownership History
Date
Name
Owned For
Owner Type
Purchase Details
Closed on
Aug 17, 2015
Sold by
West Randal S and West Deirdre L
Bought by
Harrison Beth A and Harrison Eric A
Current Estimated Value
Home Financials for this Owner
Home Financials are based on the most recent Mortgage that was taken out on this home.
Original Mortgage
$500,000
Outstanding Balance
$394,048
Interest Rate
4.09%
Mortgage Type
New Conventional
Estimated Equity
$797,125
Purchase Details
Closed on
Jun 17, 2005
Sold by
Murray John E and Murray Cathy M
Bought by
West Randal S and West Deirdre L
Home Financials for this Owner
Home Financials are based on the most recent Mortgage that was taken out on this home.
Original Mortgage
$285,000
Interest Rate
5.66%
Mortgage Type
New Conventional
Purchase Details
Closed on
Jun 30, 2000
Bought by
Murray John E and Murray Cathy M
Purchase Details
Closed on
Jun 1, 1998
Bought by
Orr Andrew A and Orr Cynthia M
Purchase Details
Closed on
Jun 5, 1996
Bought by
Shaw Russell J and Shaw Cheria D
Create a Home Valuation Report for This Property
The Home Valuation Report is an in-depth analysis detailing your home's value as well as a comparison with similar homes in the area
Home Values in the Area
Average Home Value in this Area
Purchase History
| Date | Buyer | Sale Price | Title Company |
|---|---|---|---|
| Harrison Beth A | $662,500 | None Available | |
| West Randal S | $535,000 | None Available | |
| Murray John E | $400,000 | -- | |
| Orr Andrew A | $363,500 | -- | |
| Shaw Russell J | $325,000 | -- |
Source: Public Records
Mortgage History
| Date | Status | Borrower | Loan Amount |
|---|---|---|---|
| Open | Harrison Beth A | $500,000 | |
| Previous Owner | West Randal S | $285,000 |
Source: Public Records
Tax History Compared to Growth
Tax History
| Year | Tax Paid | Tax Assessment Tax Assessment Total Assessment is a certain percentage of the fair market value that is determined by local assessors to be the total taxable value of land and additions on the property. | Land | Improvement |
|---|---|---|---|---|
| 2025 | $6,050 | $976,868 | $373,972 | $602,896 |
| 2024 | $6,011 | $976,868 | $373,972 | $602,896 |
| 2023 | $6,011 | $976,868 | $373,972 | $602,896 |
| 2022 | $4,394 | $577,410 | $284,711 | $292,699 |
| 2021 | $4,353 | $577,410 | $284,711 | $292,699 |
| 2020 | $4,123 | $577,410 | $284,711 | $292,699 |
| 2019 | $4,123 | $577,410 | $284,711 | $292,699 |
| 2018 | $3,872 | $519,366 | $272,414 | $246,952 |
| 2017 | $3,771 | $519,366 | $272,414 | $246,952 |
| 2016 | $3,758 | $519,366 | $272,414 | $246,952 |
| 2015 | $3,965 | $519,366 | $272,414 | $246,952 |
| 2014 | $4,034 | $542,851 | $305,403 | $237,448 |
Source: Public Records
Map
Nearby Homes
- 7193 Adirondack Dr
- 7246 Adirondack Dr
- 7113 Spyglass Ridge Dr
- 7405 Albemarle Dr
- 7464 Albemarle Dr
- 3995 Burton Ln
- 7721 Red Robin Trail
- 7705 Red Robin Trail
- 7852 Golf Course Dr N Unit 31
- 7843 Nine Iron Ct
- 3981 Spinnaker Place
- 4017 Halyard Dr
- 7980 Bradford Ln
- 4120 Lake Shore Rd S
- 4227 Legacy Dr
- 7946 Norman Pointe Dr
- 4237 Little Fork Cove Rd
- 0000 Spindrift Cove Unit 59
- 8065 Bay Pointe Dr
- 0000 Webbs Rd
- 8274 Blades Trail
- 8252 Blades Trail
- 8280 Blades Trail
- 8238 Blades Trail
- 8286 Blades Trail
- 7236 Albemarle Dr Unit 65
- 8292 Blades Trail
- 7247 Albemarle Dr Unit 66
- 8138 Blades Trail
- 8148 Blades Trail
- 8128 Blades Trail
- 8128 Blades Trail Unit 71A
- 8218 Blades Trail
- 8158 Blades Trail
- 8300 Blades Trail
- 7253 Teal Dr Unit 67
- 7242 Albemarle Dr Unit 64
- tbd1 Halyard Dr
- tbd1 Halyard Dr Unit 8
- 8118 Blades Trail