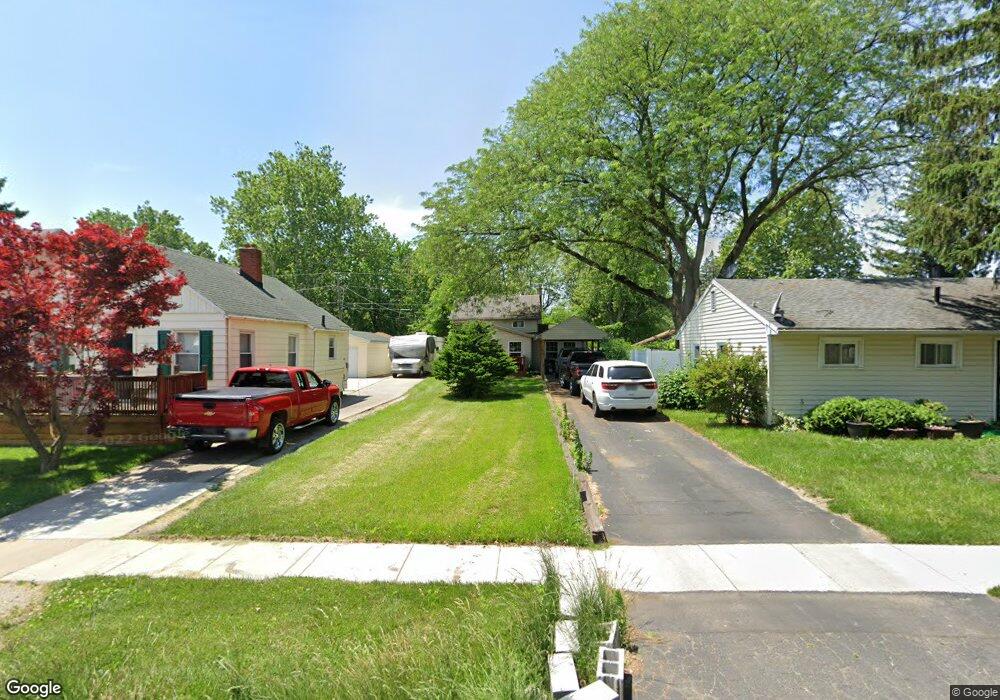
827 Broer Ave Toledo, OH 43607
Scott Park NeighborhoodEstimated Value: $82,000 - $105,000
2
Beds
1
Bath
1,128
Sq Ft
$85/Sq Ft
Est. Value
About This Home
This home is located at 827 Broer Ave, Toledo, OH 43607 and is currently estimated at $95,673, approximately $84 per square foot. 827 Broer Ave is a home located in Lucas County with nearby schools including Keyser Elementary School, Rogers High School, and Victory Academy of Toledo.
Ownership History
Date
Name
Owned For
Owner Type
Purchase Details
Closed on
Jun 24, 2022
Sold by
Harris Grecheri
Bought by
G M Harris Builders Llc
Current Estimated Value
Home Financials for this Owner
Home Financials are based on the most recent Mortgage that was taken out on this home.
Interest Rate
5.81%
Purchase Details
Closed on
Jun 21, 2022
Sold by
Harris Grecheri
Bought by
Gm Harris Builders Llc
Home Financials for this Owner
Home Financials are based on the most recent Mortgage that was taken out on this home.
Interest Rate
5.81%
Purchase Details
Closed on
Nov 17, 2014
Sold by
Gmh Investments Llc
Bought by
Harris Grecheri
Purchase Details
Closed on
Jun 27, 2011
Sold by
Harris Gregory M
Bought by
Gmh Investments
Purchase Details
Closed on
Jan 30, 1991
Sold by
Deborah Harris Mgmt Inc #
Purchase Details
Closed on
Apr 18, 1990
Sold by
Harris Gregory M
Create a Home Valuation Report for This Property
The Home Valuation Report is an in-depth analysis detailing your home's value as well as a comparison with similar homes in the area
Home Values in the Area
Average Home Value in this Area
Purchase History
| Date | Buyer | Sale Price | Title Company |
|---|---|---|---|
| G M Harris Builders Llc | $1 | -- | |
| Gm Harris Builders Llc | $300 | None Listed On Document | |
| Harris Grecheri | -- | None Available | |
| Gmh Investments | -- | None Available | |
| -- | -- | -- | |
| -- | $10,000 | -- |
Source: Public Records
Mortgage History
| Date | Status | Borrower | Loan Amount |
|---|---|---|---|
| Closed | G M Harris Builders Llc | -- |
Source: Public Records
Tax History Compared to Growth
Tax History
| Year | Tax Paid | Tax Assessment Tax Assessment Total Assessment is a certain percentage of the fair market value that is determined by local assessors to be the total taxable value of land and additions on the property. | Land | Improvement |
|---|---|---|---|---|
| 2024 | $20,167 | $26,075 | $4,795 | $21,280 |
| 2023 | $1,354 | $20,160 | $3,115 | $17,045 |
| 2022 | $1,346 | $20,160 | $3,115 | $17,045 |
| 2021 | $1,391 | $20,160 | $3,115 | $17,045 |
| 2020 | $1,502 | $19,320 | $2,940 | $16,380 |
| 2019 | $1,457 | $19,320 | $2,940 | $16,380 |
| 2018 | $1,460 | $19,320 | $2,940 | $16,380 |
| 2017 | $3,943 | $18,865 | $2,870 | $15,995 |
| 2016 | $2,882 | $53,900 | $8,200 | $45,700 |
| 2015 | $1,487 | $53,900 | $8,200 | $45,700 |
| 2014 | $1,829 | $18,870 | $2,870 | $16,000 |
| 2013 | $1,220 | $18,870 | $2,870 | $16,000 |
Source: Public Records
Map
Nearby Homes
- 914 Turner Ave
- 1117 Broer Ave
- 1125 Secor Rd
- 615 Cuthbert Rd
- 514 Conrad Ave
- 1408 Roosevelt Ave
- 1743 Kensington Rd
- 1702 Alvin St
- 2666 Montebello Rd
- 1752 Pilgrim Rd
- 2013 Bretton Place
- 1809 Pilgrim Rd
- 1106 Alldays Ave
- 1730 Alvin St
- 913 Coventry Ave
- 1735 Perth St
- 811 N University Ave
- 1814 Alvin St
- 908 Coventry Ave
- 1901 Alvin St