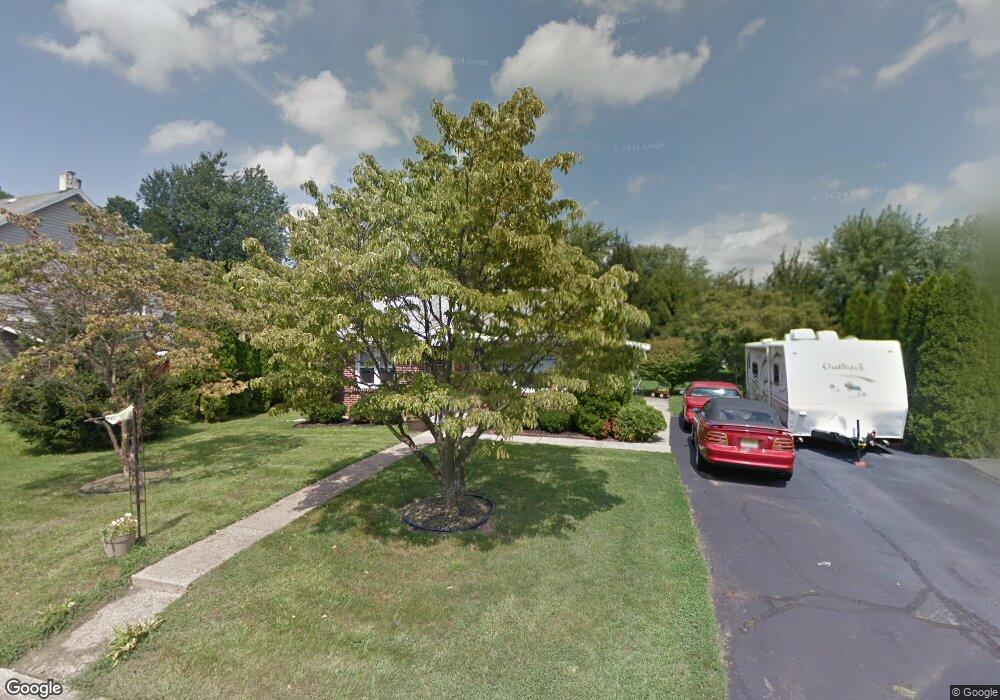
827 Culkin St Phillipsburg, NJ 08865
Estimated Value: $266,574 - $302,000
--
Bed
--
Bath
864
Sq Ft
$333/Sq Ft
Est. Value
About This Home
This home is located at 827 Culkin St, Phillipsburg, NJ 08865 and is currently estimated at $287,894, approximately $333 per square foot. 827 Culkin St is a home located in Warren County with nearby schools including Phillipsburg High School, Easton Arts Academy Elementary Cs, and Sts. Philip & James School.
Ownership History
Date
Name
Owned For
Owner Type
Purchase Details
Closed on
Dec 5, 2017
Sold by
Hoagland David and Hoagland Maria
Bought by
Mercado Kayla
Current Estimated Value
Home Financials for this Owner
Home Financials are based on the most recent Mortgage that was taken out on this home.
Original Mortgage
$130,950
Outstanding Balance
$110,134
Interest Rate
3.9%
Mortgage Type
New Conventional
Estimated Equity
$177,760
Purchase Details
Closed on
Aug 30, 2011
Sold by
Hoagland Maria
Bought by
Hoagland Maria and Hoagland David
Create a Home Valuation Report for This Property
The Home Valuation Report is an in-depth analysis detailing your home's value as well as a comparison with similar homes in the area
Home Values in the Area
Average Home Value in this Area
Purchase History
| Date | Buyer | Sale Price | Title Company |
|---|---|---|---|
| Mercado Kayla | $135,000 | Pls Title & Settlement Servi | |
| Hoagland Maria | -- | None Available |
Source: Public Records
Mortgage History
| Date | Status | Borrower | Loan Amount |
|---|---|---|---|
| Open | Mercado Kayla | $130,950 |
Source: Public Records
Tax History Compared to Growth
Tax History
| Year | Tax Paid | Tax Assessment Tax Assessment Total Assessment is a certain percentage of the fair market value that is determined by local assessors to be the total taxable value of land and additions on the property. | Land | Improvement |
|---|---|---|---|---|
| 2025 | $5,799 | $127,600 | $37,900 | $89,700 |
| 2024 | $5,354 | $127,600 | $37,900 | $89,700 |
| 2023 | $5,293 | $127,600 | $37,900 | $89,700 |
| 2022 | $5,293 | $127,600 | $37,900 | $89,700 |
| 2021 | $5,123 | $127,600 | $37,900 | $89,700 |
| 2020 | $5,158 | $127,600 | $37,900 | $89,700 |
| 2019 | $5,080 | $127,600 | $37,900 | $89,700 |
| 2018 | $5,080 | $127,600 | $37,900 | $89,700 |
| 2017 | $5,057 | $127,600 | $37,900 | $89,700 |
| 2016 | $4,979 | $127,600 | $37,900 | $89,700 |
| 2015 | $4,941 | $127,600 | $37,900 | $89,700 |
| 2014 | $4,780 | $127,600 | $37,900 | $89,700 |
Source: Public Records
Map
Nearby Homes