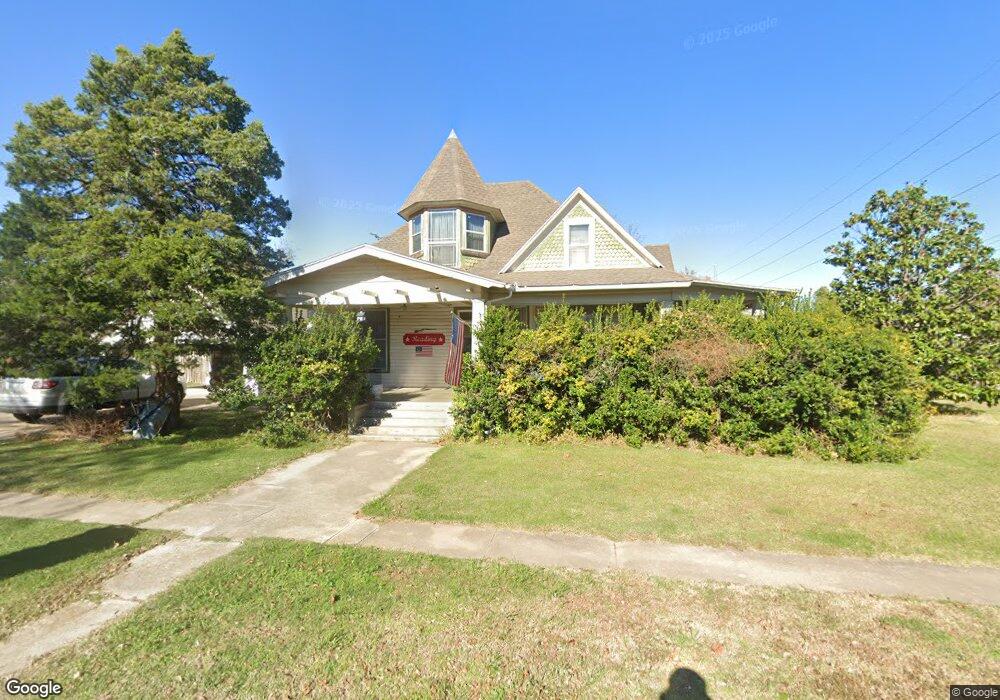
827 E Seneca Ave McAlester, OK 74501
Estimated Value: $195,788 - $265,000
3
Beds
3
Baths
2,415
Sq Ft
$96/Sq Ft
Est. Value
About This Home
This home is located at 827 E Seneca Ave, McAlester, OK 74501 and is currently estimated at $231,197, approximately $95 per square foot. 827 E Seneca Ave is a home located in Pittsburg County with nearby schools including McAlester High School, Mcalester Christian Academy, and Lakewood Christian School.
Ownership History
Date
Name
Owned For
Owner Type
Purchase Details
Closed on
Sep 27, 2013
Sold by
Mitchell Nicholas A and Mitchell Maggie J
Bought by
Reading Lisa M and Reading Harry L
Current Estimated Value
Home Financials for this Owner
Home Financials are based on the most recent Mortgage that was taken out on this home.
Original Mortgage
$132,900
Outstanding Balance
$98,807
Interest Rate
4.46%
Mortgage Type
New Conventional
Estimated Equity
$132,390
Purchase Details
Closed on
Sep 21, 2010
Sold by
Glover Charles R and Glover Jenny W
Bought by
Mitchell Nicholas and Mitchell Maggie J
Purchase Details
Closed on
Sep 16, 2009
Sold by
Cole Charles E and Cole Karen D
Bought by
Glover Charles R and Glover Jenny W
Purchase Details
Closed on
Jun 8, 2001
Sold by
Anderson Park
Bought by
Cole Charles
Create a Home Valuation Report for This Property
The Home Valuation Report is an in-depth analysis detailing your home's value as well as a comparison with similar homes in the area
Purchase History
| Date | Buyer | Sale Price | Title Company |
|---|---|---|---|
| Reading Lisa M | $152,000 | None Available | |
| Mitchell Nicholas | $130,000 | None Available | |
| Glover Charles R | $130,000 | None Available | |
| Cole Charles | $89,500 | -- |
Source: Public Records
Mortgage History
| Date | Status | Borrower | Loan Amount |
|---|---|---|---|
| Open | Reading Lisa M | $132,900 |
Source: Public Records
Tax History
| Year | Tax Paid | Tax Assessment Tax Assessment Total Assessment is a certain percentage of the fair market value that is determined by local assessors to be the total taxable value of land and additions on the property. | Land | Improvement |
|---|---|---|---|---|
| 2025 | $1,408 | $16,024 | $9,559 | $6,465 |
| 2024 | $1,409 | $16,033 | $2,110 | $13,923 |
| 2023 | $1,406 | $16,033 | $2,110 | $13,923 |
| 2022 | $1,404 | $16,033 | $2,110 | $13,923 |
| 2021 | $1,396 | $16,033 | $2,110 | $13,923 |
| 2020 | $1,337 | $15,261 | $2,110 | $13,151 |
| 2019 | $1,171 | $14,534 | $2,110 | $12,424 |
| 2018 | $1,173 | $14,535 | $2,110 | $12,425 |
| 2017 | $1,184 | $14,535 | $2,110 | $12,425 |
| 2016 | $1,179 | $14,535 | $2,110 | $12,425 |
| 2015 | $1,244 | $16,720 | $777 | $15,943 |
| 2014 | $1,244 | $16,720 | $777 | $15,943 |
Source: Public Records
Map
Nearby Homes
- 810 E Miami Ave
- 800 S 9th St
- 730 S 9th St
- 1004 E Osage Ave
- 911 S Strong Blvd
- 1020 S 6th St
- 0 E Seminole Ave
- 621 E Seminole Ave
- 1405 S 9th St
- 415 E Seneca Ave
- 602 E Comanche Ave
- 520 E Peoria Ave
- 1407 S 9th St
- 1410 S 5th St
- 703 S 5th St
- 1526 S 5th St
- 724 E Delaware Ave
- 416 S 6th St
- 803 E Delaware Ave
- 1300 S 2nd St
- 815 E Seneca Ave
- 818 E Miami Ave
- 905 E Seneca Ave
- 824 E Miami Ave
- 811 E Seneca Ave
- 816 E Miami Ave
- 812 E Miami Ave
- 820 E Seneca Ave
- 822 E Seneca Ave
- 818 E Seneca Ave
- 900 E Miami Ave
- 808 E Seneca Ave
- 801 E Seneca Ave
- 907 E Seneca Ave
- 806 E Seneca Ave
- 902 E Miami Ave
- 804 E Seneca Ave
- 800 E Miami Ave
- 800 E Seneca Ave
- 1015 S 9th St
Your Personal Tour Guide
Ask me questions while you tour the home.