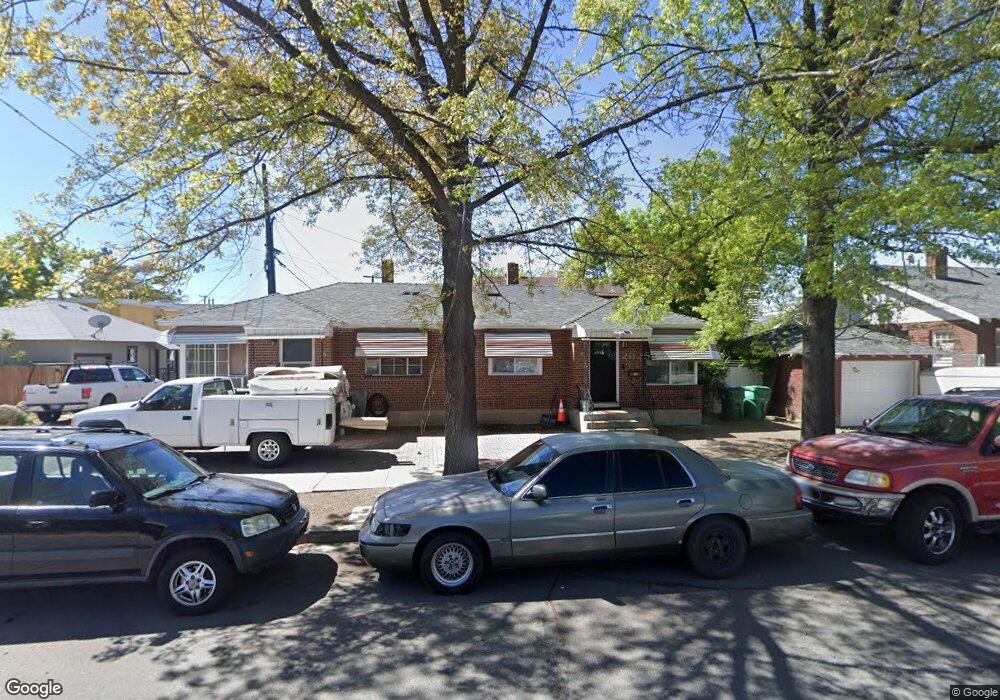
827 E St Sparks, NV 89431
Downtown Sparks NeighborhoodEstimated Value: $499,694 - $714,000
6
Beds
3
Baths
2,552
Sq Ft
$229/Sq Ft
Est. Value
About This Home
This home is located at 827 E St, Sparks, NV 89431 and is currently estimated at $584,674, approximately $229 per square foot. 827 E St is a home located in Washoe County with nearby schools including Robert Mitchell Elementary School, Sparks Middle School, and Sparks High School.
Ownership History
Date
Name
Owned For
Owner Type
Purchase Details
Closed on
Jun 29, 2004
Sold by
Edwards Joan F
Bought by
Aparicio Juan and Aparicio Leticia
Current Estimated Value
Home Financials for this Owner
Home Financials are based on the most recent Mortgage that was taken out on this home.
Original Mortgage
$198,750
Outstanding Balance
$105,311
Interest Rate
7.5%
Mortgage Type
Purchase Money Mortgage
Estimated Equity
$479,363
Purchase Details
Closed on
Jun 7, 1994
Sold by
Edwards William M and Edwards Joan F
Bought by
Edwards William M and Edwards Joan F
Create a Home Valuation Report for This Property
The Home Valuation Report is an in-depth analysis detailing your home's value as well as a comparison with similar homes in the area
Home Values in the Area
Average Home Value in this Area
Purchase History
| Date | Buyer | Sale Price | Title Company |
|---|---|---|---|
| Aparicio Juan | $265,000 | Western Title Incorporated | |
| Edwards William M | -- | -- | |
| Edwards William M | -- | -- |
Source: Public Records
Mortgage History
| Date | Status | Borrower | Loan Amount |
|---|---|---|---|
| Open | Aparicio Juan | $198,750 |
Source: Public Records
Tax History
| Year | Tax Paid | Tax Assessment Tax Assessment Total Assessment is a certain percentage of the fair market value that is determined by local assessors to be the total taxable value of land and additions on the property. | Land | Improvement |
|---|---|---|---|---|
| 2026 | -- | $85,435 | $47,250 | $38,185 |
| 2025 | $1,778 | $85,000 | $47,250 | $37,750 |
| 2024 | $1,778 | $81,464 | $43,960 | $37,504 |
| 2023 | $1,647 | $78,413 | $44,625 | $33,788 |
| 2022 | $1,526 | $62,656 | $34,685 | $27,971 |
| 2021 | $1,414 | $57,656 | $30,310 | $27,346 |
| 2020 | $1,328 | $57,195 | $30,310 | $26,885 |
| 2019 | $1,267 | $50,850 | $25,235 | $25,615 |
| 2018 | $1,209 | $43,132 | $18,585 | $24,547 |
| 2017 | $1,160 | $41,865 | $17,850 | $24,015 |
| 2016 | $1,131 | $38,588 | $14,700 | $23,888 |
| 2015 | $1,129 | $34,811 | $11,130 | $23,681 |
| 2014 | $1,095 | $31,749 | $9,450 | $22,299 |
| 2013 | -- | $29,143 | $7,875 | $21,268 |
Source: Public Records
Map
Nearby Homes
Your Personal Tour Guide
Ask me questions while you tour the home.