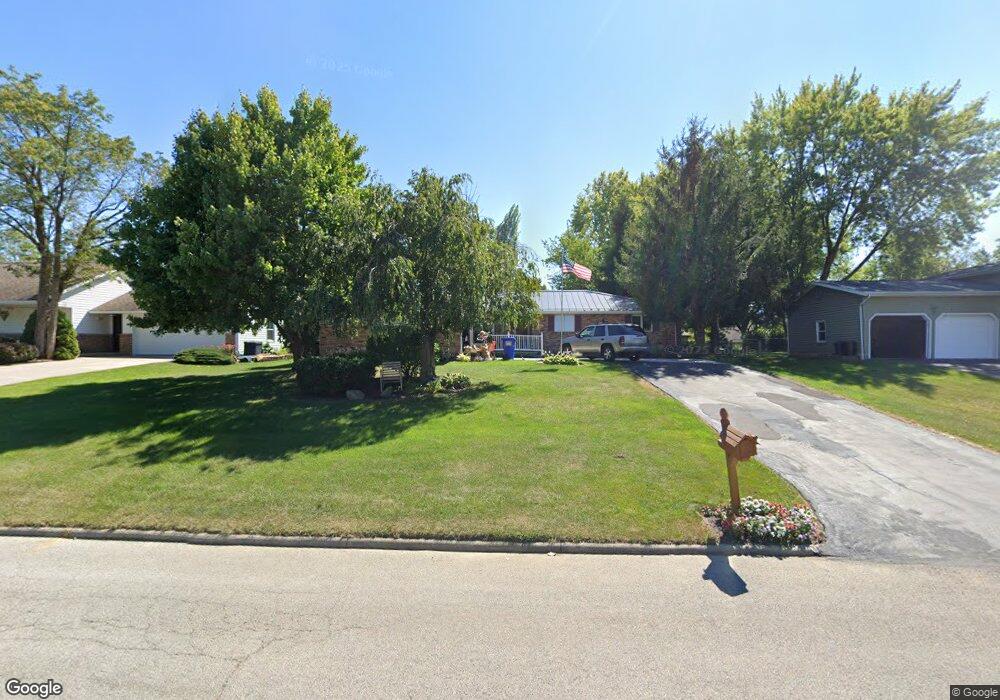
827 Edgehill Rd Findlay, OH 45840
Estimated Value: $264,530 - $309,000
3
Beds
2
Baths
1,689
Sq Ft
$169/Sq Ft
Est. Value
About This Home
This home is located at 827 Edgehill Rd, Findlay, OH 45840 and is currently estimated at $284,633, approximately $168 per square foot. 827 Edgehill Rd is a home located in Hancock County with nearby schools including Bigelow Hill Elementary School, Northview Elementary School, and Glenwood Middle School.
Ownership History
Date
Name
Owned For
Owner Type
Purchase Details
Closed on
Feb 21, 1996
Sold by
Harris John
Bought by
Cantu John and Cantu Jill
Current Estimated Value
Home Financials for this Owner
Home Financials are based on the most recent Mortgage that was taken out on this home.
Original Mortgage
$98,900
Outstanding Balance
$665
Interest Rate
7.16%
Mortgage Type
New Conventional
Estimated Equity
$283,968
Purchase Details
Closed on
Nov 1, 1994
Sold by
Short Stephen
Bought by
Harris John and Harris Tracy
Home Financials for this Owner
Home Financials are based on the most recent Mortgage that was taken out on this home.
Original Mortgage
$111,625
Interest Rate
8.68%
Mortgage Type
New Conventional
Purchase Details
Closed on
Dec 2, 1991
Bought by
Short Stephen W and Short Debra S
Purchase Details
Closed on
Sep 16, 1985
Bought by
Streacker Karl A and Streacker Lori A
Create a Home Valuation Report for This Property
The Home Valuation Report is an in-depth analysis detailing your home's value as well as a comparison with similar homes in the area
Home Values in the Area
Average Home Value in this Area
Purchase History
| Date | Buyer | Sale Price | Title Company |
|---|---|---|---|
| Cantu John | $123,900 | -- | |
| Harris John | $117,500 | -- | |
| Short Stephen W | $96,000 | -- | |
| Streacker Karl A | $10,000 | -- |
Source: Public Records
Mortgage History
| Date | Status | Borrower | Loan Amount |
|---|---|---|---|
| Open | Cantu John | $98,900 | |
| Previous Owner | Harris John | $111,625 |
Source: Public Records
Tax History
| Year | Tax Paid | Tax Assessment Tax Assessment Total Assessment is a certain percentage of the fair market value that is determined by local assessors to be the total taxable value of land and additions on the property. | Land | Improvement |
|---|---|---|---|---|
| 2024 | $2,128 | $68,480 | $10,950 | $57,530 |
| 2023 | $2,487 | $68,480 | $10,950 | $57,530 |
| 2022 | $2,486 | $68,480 | $10,950 | $57,530 |
| 2021 | $2,289 | $55,010 | $10,950 | $44,060 |
| 2020 | $2,288 | $55,010 | $10,950 | $44,060 |
| 2019 | $2,436 | $55,010 | $10,950 | $44,060 |
| 2018 | $2,294 | $47,830 | $9,520 | $38,310 |
| 2017 | $1,040 | $47,830 | $9,520 | $38,310 |
| 2016 | $2,051 | $47,830 | $9,520 | $38,310 |
| 2015 | $2,087 | $47,740 | $10,120 | $37,620 |
| 2014 | $2,059 | $47,080 | $10,120 | $36,960 |
| 2012 | $2,073 | $47,080 | $10,120 | $36,960 |
Source: Public Records
Map
Nearby Homes
- 2411 Villa West Dr
- 2605 Eton Place
- 701 W Melrose Ave
- 724 Edith Ave
- 323 W Bigelow Ave
- 3106 Saddlebrook
- 1409 Cypress Lake
- 3315 Crosshill Dr
- 2418 Hollybrook Dr
- 2419 Hollybrook Dr
- 2400 Hollybrook Dr
- 10321 Wheatfield Dr
- 1617 Bay Hill Dr
- 6535 Silver Lake Dr
- 2215 Beecher St
- 2604 N Main St
- 120 W Melrose Ave
- 1934 Geffs Ave
- 3239 N Main St
- 146 Clifton Ave
- 821 Edgehill Rd
- 833 Edgehill Rd
- 2612 Sweetwater Rd
- 2608 Sweetwater Rd
- 815 Edgehill Rd
- 901 Edgehill Rd
- 2616 Sweetwater Rd
- 830 Edgehill Rd
- 2604 Sweetwater Rd
- 818 Edgehill Rd
- 900 Edgehill Rd
- 907 Edgehill Rd
- 809 Edgehill Rd
- 812 Edgehill Rd
- 829 W Bigelow Ave
- 2620 Sweetwater Rd
- 827 W Bigelow Ave Unit 15
- 2613 Sweetwater Rd
- 2610 Westmoor Rd
- 2607 Sweetwater Rd
Your Personal Tour Guide
Ask me questions while you tour the home.