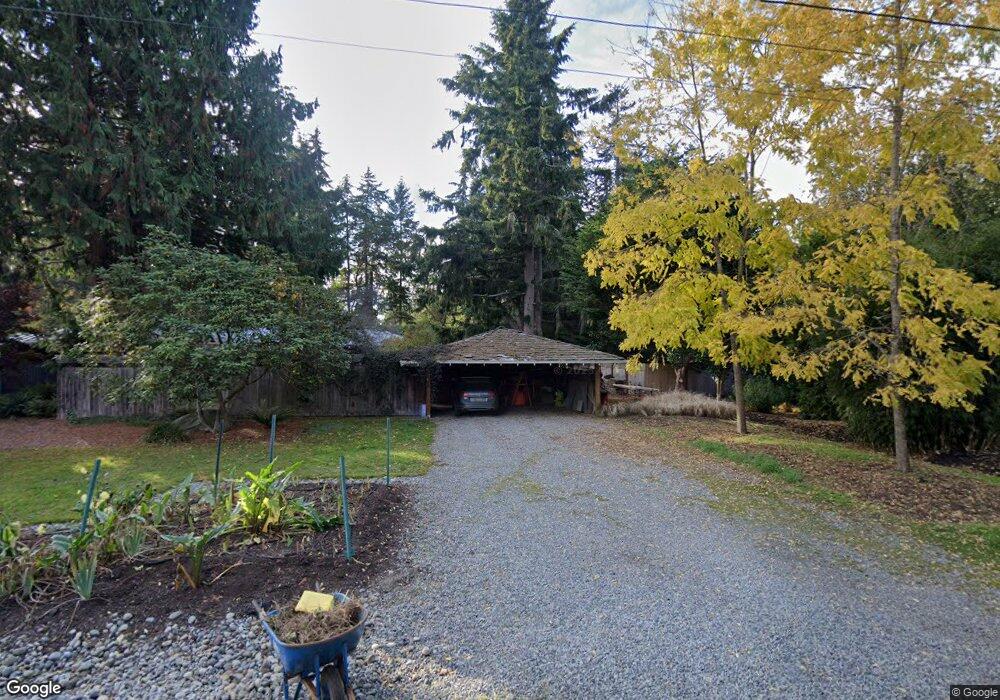
827 Fairview Ave NE Bainbridge Island, WA 98110
Estimated Value: $1,176,000 - $1,289,000
3
Beds
2
Baths
1,936
Sq Ft
$643/Sq Ft
Est. Value
About This Home
This home is located at 827 Fairview Ave NE, Bainbridge Island, WA 98110 and is currently estimated at $1,245,117, approximately $643 per square foot. 827 Fairview Ave NE is a home located in Kitsap County with nearby schools including Bainbridge High School, St. Cecilia Catholic School, and Madrona School.
Ownership History
Date
Name
Owned For
Owner Type
Purchase Details
Closed on
Feb 25, 2016
Sold by
Eerkes Leslie W and Eerkes Tera L
Bought by
Eerkes Leslie W and Eerkes Tera L
Current Estimated Value
Purchase Details
Closed on
Jun 6, 2003
Sold by
Morrow Daniel R
Bought by
Eerkes Leslie W and Newman Tera
Home Financials for this Owner
Home Financials are based on the most recent Mortgage that was taken out on this home.
Original Mortgage
$231,200
Outstanding Balance
$89,986
Interest Rate
4.25%
Mortgage Type
Purchase Money Mortgage
Estimated Equity
$1,155,131
Purchase Details
Closed on
Sep 19, 2000
Sold by
Davies Iola M
Bought by
Morrow Daniel R
Home Financials for this Owner
Home Financials are based on the most recent Mortgage that was taken out on this home.
Original Mortgage
$189,600
Interest Rate
8.38%
Create a Home Valuation Report for This Property
The Home Valuation Report is an in-depth analysis detailing your home's value as well as a comparison with similar homes in the area
Home Values in the Area
Average Home Value in this Area
Purchase History
| Date | Buyer | Sale Price | Title Company |
|---|---|---|---|
| Eerkes Leslie W | -- | None Available | |
| Eerkes Leslie W | $289,000 | Land Title Company | |
| Morrow Daniel R | -- | Pacific Nw Title |
Source: Public Records
Mortgage History
| Date | Status | Borrower | Loan Amount |
|---|---|---|---|
| Open | Eerkes Leslie W | $231,200 | |
| Previous Owner | Morrow Daniel R | $189,600 | |
| Closed | Eerkes Leslie W | $28,900 |
Source: Public Records
Tax History Compared to Growth
Tax History
| Year | Tax Paid | Tax Assessment Tax Assessment Total Assessment is a certain percentage of the fair market value that is determined by local assessors to be the total taxable value of land and additions on the property. | Land | Improvement |
|---|---|---|---|---|
| 2026 | $8,365 | $1,030,800 | $279,220 | $751,580 |
| 2025 | $8,365 | $1,030,800 | $279,220 | $751,580 |
| 2024 | $7,994 | $1,030,800 | $279,220 | $751,580 |
| 2023 | $8,341 | $1,030,800 | $279,220 | $751,580 |
| 2022 | $6,752 | $707,860 | $223,500 | $484,360 |
| 2021 | $6,195 | $618,150 | $194,170 | $423,980 |
| 2020 | $5,902 | $579,920 | $181,600 | $398,320 |
| 2019 | $5,671 | $568,190 | $177,410 | $390,780 |
| 2018 | $5,751 | $450,290 | $139,690 | $310,600 |
| 2017 | $4,748 | $450,290 | $139,690 | $310,600 |
| 2016 | $4,265 | $383,620 | $139,690 | $243,930 |
| 2015 | $3,867 | $353,880 | $139,690 | $214,190 |
| 2014 | -- | $345,980 | $139,690 | $206,290 |
| 2013 | -- | $345,980 | $139,690 | $206,290 |
Source: Public Records
Map
Nearby Homes
- 7551 Madrona Dr NE
- 7268 Madrona Dr NE
- 1245 High School Rd NE
- 1237 Hawley Way NE
- 502 Cave Ave NE
- 965 Winslow Way E Unit 104
- 744 Hanami Ln NE
- 1314 Polly's Ln
- 610 NE Vineyard Ln Unit A104
- 752 NE Vineyard Ln Unit L205
- Three Story Townhome Plan at Wintergreen Townhomes - Winter Green Townhomes
- 1349 Nolta Loop NE
- 1341 Nolta Loop NE
- 1339 Nolta Loop NE
- 511 Groos Ln NE
- 428 Harborview Dr SE Unit 112
- 360 Knechtel Way NE Unit 201
- 346 Wyatt Way NE Unit 10
- 465 Winslow Way E Unit 108
- 300 High School Rd NE Unit 318
- 755 Fairview Ave NE
- 778 Fairview Ave NE Unit 11
- 778 Fairview Ave NE
- 764 Fairview Ave NE Unit 10
- 764 Fairview Ave NE
- 800 Park Ave NE
- 800 Fairview Ave NE
- 772 Park Ave NE
- 890 Park Ave NE
- 1928 NE Dingley Rd
- 1966 Willow Ave NE
- 820 Fairview Ave NE
- 860 Fairview Ave NE
- 1890 Willow Ave NE
- 786 Fairview Ave NE
- 2007 NE Dingley Rd
- 668 Fairview Ave NE Unit 5
- 668 Fairview Ave NE
- 1921 Willow Ave NE
- 801 Park Ave NE