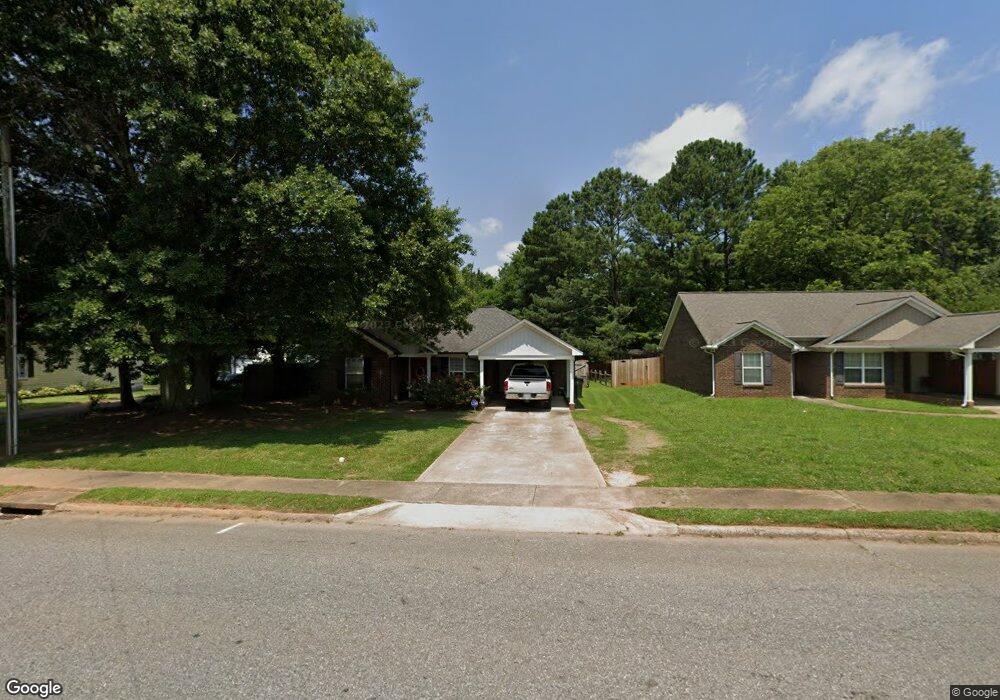
827 N Piedmont Ave Kings Mountain, NC 28086
Estimated Value: $229,085 - $264,000
--
Bed
--
Bath
1,153
Sq Ft
$215/Sq Ft
Est. Value
About This Home
This home is located at 827 N Piedmont Ave, Kings Mountain, NC 28086 and is currently estimated at $247,521, approximately $214 per square foot. 827 N Piedmont Ave is a home located in Cleveland County with nearby schools including North Elementary School, Kings Mountain Middle, and Kings Mountain Intermediate School.
Ownership History
Date
Name
Owned For
Owner Type
Purchase Details
Closed on
Mar 6, 2015
Sold by
Eagles Gate Llc
Bought by
Mcclain Lavondra Boyce and Mcclain Charles Edward
Current Estimated Value
Home Financials for this Owner
Home Financials are based on the most recent Mortgage that was taken out on this home.
Original Mortgage
$102,865
Outstanding Balance
$78,958
Interest Rate
3.74%
Mortgage Type
VA
Estimated Equity
$168,563
Purchase Details
Closed on
Aug 16, 2010
Sold by
Mcdonald Michael P and Mcdonald Teresa R
Bought by
Eagles Gate Llc
Purchase Details
Closed on
Aug 28, 2009
Sold by
Hall Builders Inc
Bought by
Mcdonald Michael P and Mcdonald Teresa R
Home Financials for this Owner
Home Financials are based on the most recent Mortgage that was taken out on this home.
Original Mortgage
$95,120
Interest Rate
5.11%
Mortgage Type
New Conventional
Create a Home Valuation Report for This Property
The Home Valuation Report is an in-depth analysis detailing your home's value as well as a comparison with similar homes in the area
Home Values in the Area
Average Home Value in this Area
Purchase History
| Date | Buyer | Sale Price | Title Company |
|---|---|---|---|
| Mcclain Lavondra Boyce | $101,000 | None Available | |
| Eagles Gate Llc | $110,000 | None Available | |
| Mcdonald Michael P | $119,000 | None Available | |
| Mcdonald Michael P | $119,000 | None Available |
Source: Public Records
Mortgage History
| Date | Status | Borrower | Loan Amount |
|---|---|---|---|
| Open | Mcclain Lavondra Boyce | $102,865 | |
| Previous Owner | Mcdonald Michael P | $95,120 |
Source: Public Records
Tax History Compared to Growth
Tax History
| Year | Tax Paid | Tax Assessment Tax Assessment Total Assessment is a certain percentage of the fair market value that is determined by local assessors to be the total taxable value of land and additions on the property. | Land | Improvement |
|---|---|---|---|---|
| 2025 | $2,480 | $241,957 | $13,356 | $228,601 |
| 2024 | $1,613 | $136,004 | $7,479 | $128,525 |
| 2023 | $1,605 | $136,004 | $7,479 | $128,525 |
| 2022 | $1,537 | $136,004 | $7,479 | $128,525 |
| 2021 | $1,545 | $136,004 | $7,479 | $128,525 |
| 2020 | $1,364 | $116,650 | $7,479 | $109,171 |
| 2019 | $1,364 | $116,650 | $7,479 | $109,171 |
| 2018 | $1,362 | $116,650 | $7,479 | $109,171 |
| 2017 | $1,356 | $116,650 | $7,479 | $109,171 |
| 2016 | $1,360 | $116,650 | $7,479 | $109,171 |
| 2015 | $1,243 | $109,348 | $6,678 | $102,670 |
| 2014 | $1,243 | $109,348 | $6,678 | $102,670 |
Source: Public Records
Map
Nearby Homes
- 810 4th St
- 1003 Ramseur St
- 808 3rd St
- 205 Stowe Acres
- 905 Gantt St
- 200 Lackey St Unit 1-2
- 823 1st St
- 223 # Benfield Rd
- 223 Benfield Rd
- 215 Benfield Rd
- 213 Benfield Rd
- 109 Fulton St Unit 9
- 120 Center St
- 814 Grace St
- 116 Walker St
- 921 Church St
- 300 Fulton St
- 1220 N Piedmont Ave
- 408 Walnut St
- 409 Chestnut St
- 827 N Piedmont Ave
- 829 N Piedmont Ave
- 825 N Piedmont Ave
- 831 N Piedmont Ave
- 831 N Piedmont Ave Unit 22
- 826 N Piedmont Ave
- 824 N Piedmont Ave
- 824 N Piedmont Ave
- 828 N Piedmont Ave
- 830 N Piedmont Ave
- 834 N Piedmont Ave
- 822 N Piedmont Ave
- 905 N Piedmont Ave
- 821 N Piedmont Ave
- 818 N Piedmont Ave
- 200 Fairview St
- 819 N Piedmont Ave
- 907 N Piedmont Ave
- 206 Fairview St
- 204 Fairview St