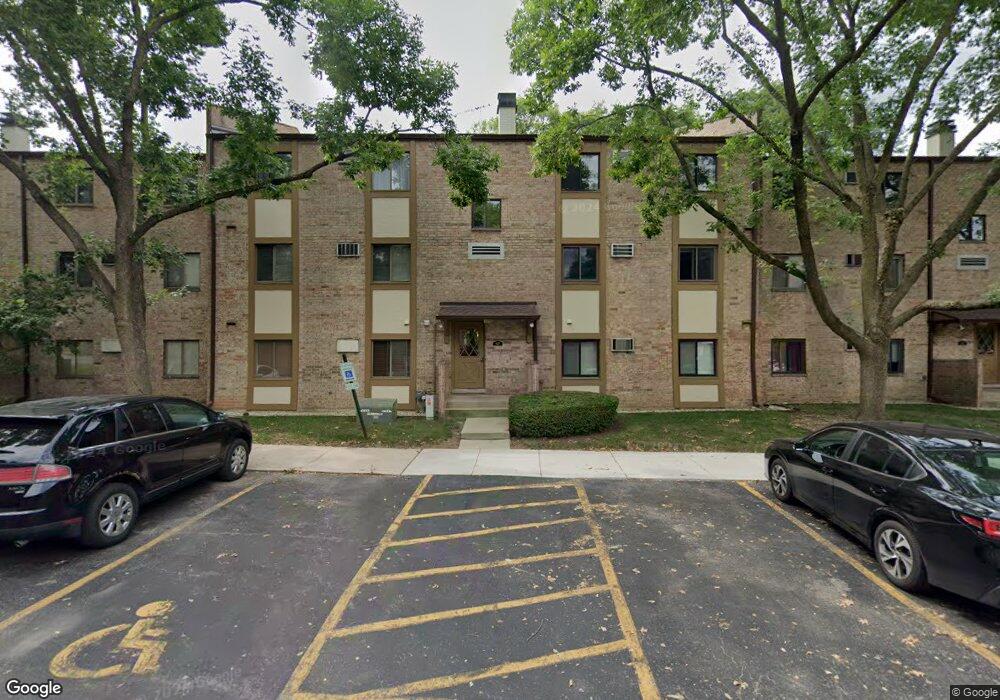
827 S Dwyer Ave Unit D Arlington Heights, IL 60005
Busse Woods NeighborhoodEstimated Value: $208,377 - $230,000
2
Beds
1
Bath
950
Sq Ft
$235/Sq Ft
Est. Value
About This Home
This home is located at 827 S Dwyer Ave Unit D, Arlington Heights, IL 60005 and is currently estimated at $222,844, approximately $234 per square foot. 827 S Dwyer Ave Unit D is a home located in Cook County with nearby schools including Westgate Elementary School, South Middle School, and Rolling Meadows High School.
Ownership History
Date
Name
Owned For
Owner Type
Purchase Details
Closed on
Dec 2, 2020
Sold by
Howe Timothy and Howe Annette
Bought by
Howe Timothy M and Howe Annette A
Current Estimated Value
Purchase Details
Closed on
Nov 16, 2011
Sold by
Vasiliauskas Robertas
Bought by
Howe Timothy and Howe Annette
Purchase Details
Closed on
Jun 27, 2003
Sold by
Miroballi Daniel V
Bought by
Vasiliauskas Robertas
Home Financials for this Owner
Home Financials are based on the most recent Mortgage that was taken out on this home.
Original Mortgage
$124,450
Interest Rate
3.87%
Mortgage Type
Unknown
Purchase Details
Closed on
May 15, 1999
Sold by
Oliver Cynthia
Bought by
Miroballi Daniel V
Home Financials for this Owner
Home Financials are based on the most recent Mortgage that was taken out on this home.
Original Mortgage
$68,500
Interest Rate
7.93%
Purchase Details
Closed on
Mar 15, 1996
Sold by
Gersey Cynthia C
Bought by
Oliver Cynthia
Create a Home Valuation Report for This Property
The Home Valuation Report is an in-depth analysis detailing your home's value as well as a comparison with similar homes in the area
Home Values in the Area
Average Home Value in this Area
Purchase History
| Date | Buyer | Sale Price | Title Company |
|---|---|---|---|
| Howe Timothy M | -- | Attorney | |
| Howe Timothy | $60,500 | First American Title Ins Co | |
| Vasiliauskas Robertas | $131,000 | Stewart Title Of Illinois | |
| Miroballi Daniel V | $83,000 | -- | |
| Oliver Cynthia | -- | -- |
Source: Public Records
Mortgage History
| Date | Status | Borrower | Loan Amount |
|---|---|---|---|
| Previous Owner | Vasiliauskas Robertas | $124,450 | |
| Previous Owner | Miroballi Daniel V | $68,500 | |
| Closed | Miroballi Daniel V | $13,295 |
Source: Public Records
Tax History Compared to Growth
Tax History
| Year | Tax Paid | Tax Assessment Tax Assessment Total Assessment is a certain percentage of the fair market value that is determined by local assessors to be the total taxable value of land and additions on the property. | Land | Improvement |
|---|---|---|---|---|
| 2024 | $3,230 | $11,801 | $2,377 | $9,424 |
| 2023 | $3,111 | $11,801 | $2,377 | $9,424 |
| 2022 | $3,111 | $11,801 | $2,377 | $9,424 |
| 2021 | $3,204 | $10,644 | $371 | $10,273 |
| 2020 | $3,121 | $10,644 | $371 | $10,273 |
| 2019 | $3,110 | $11,846 | $371 | $11,475 |
| 2018 | $2,257 | $7,735 | $297 | $7,438 |
| 2017 | $2,231 | $7,735 | $297 | $7,438 |
| 2016 | $2,080 | $7,735 | $297 | $7,438 |
| 2015 | $1,891 | $6,405 | $1,411 | $4,994 |
| 2014 | $1,836 | $6,405 | $1,411 | $4,994 |
| 2013 | $1,790 | $6,405 | $1,411 | $4,994 |
Source: Public Records
Map
Nearby Homes
- 1207 W Keating Dr
- 1602 W Orchard Place Unit 1602C
- 515 S Princeton Ave
- 1025 S Fernandez Ave Unit 4C
- 1025 S Fernandez Ave Unit 3M
- 1114 S Fernandez Ave
- 1106 S New Wilke Rd Unit 404
- 502 S Reuter Dr
- 1107 S Old Wilke Rd Unit 201
- 2100 Martin Ln
- 1127 S Old Wilke Rd Unit 403
- 1107 W White Oak St
- 3805 Wren Ln
- 316 S Reuter Dr
- 1206 S New Wilke Rd Unit 108
- 2201 Kingfisher Ln
- 1207 S Old Wilke Rd Unit 303
- 1217 S Old Wilke Rd Unit 11406
- 1306 S Walnut Ave
- 1227 S Old Wilke Rd Unit 12209
- 827 S Dwyer Ave Unit 827C
- 827 S Dwyer Ave Unit 827D
- 827 S Dwyer Ave Unit 827F
- 827 S Dwyer Ave Unit 827E
- 827 S Dwyer Ave Unit 827A
- 827 S Dwyer Ave Unit 827B
- 827 S Dwyer Ave Unit A
- 827 S Dwyer Ave
- 827 S Dwyer Ave Unit F
- 827 S Dwyer Ave Unit C
- 825 S Dwyer Ave Unit A
- 825 S Dwyer Ave Unit 825B
- 825 S Dwyer Ave Unit 825E
- 825 S Dwyer Ave Unit 825D
- 825 S Dwyer Ave Unit 825C
- 825 S Dwyer Ave Unit 825F
- 825 S Dwyer Ave Unit 825A
- 825 S Dwyer Ave Unit C
- 825 S Dwyer Ave Unit F
- 829 S Dwyer Ave Unit F