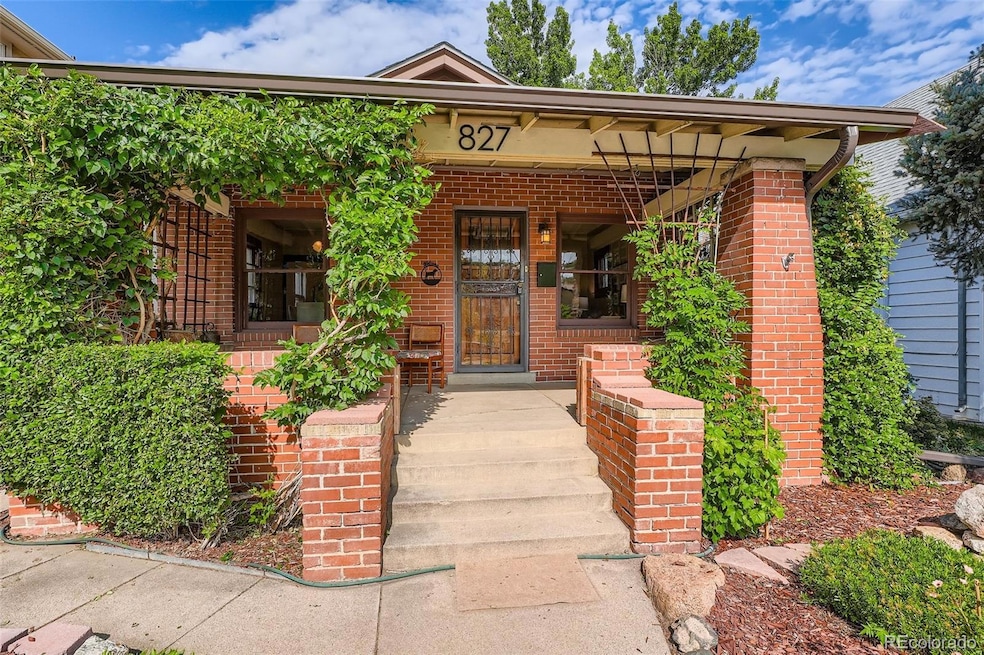
827 S Sherman St Denver, CO 80209
Washington Park West NeighborhoodEstimated payment $3,880/month
Highlights
- Property is near public transit
- Wood Flooring
- Private Yard
- Lincoln Elementary School Rated A-
- Bonus Room
- No HOA
About This Home
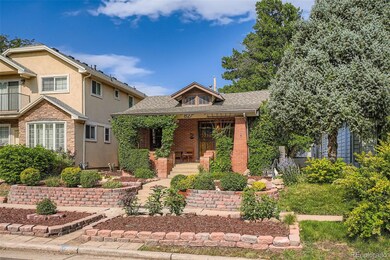
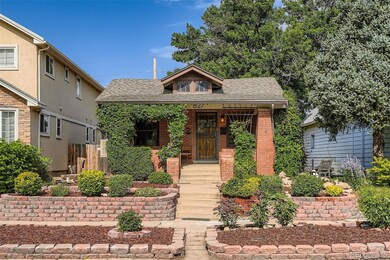
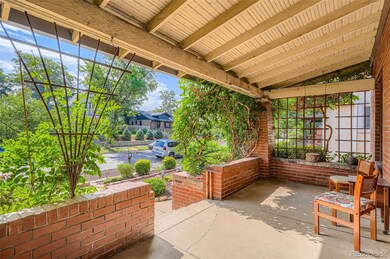
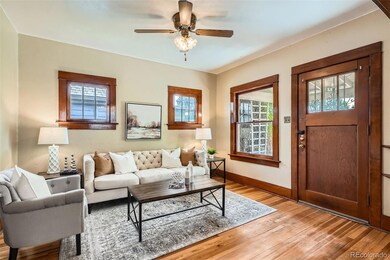
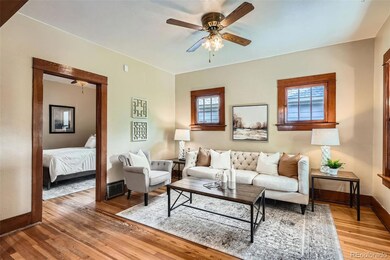
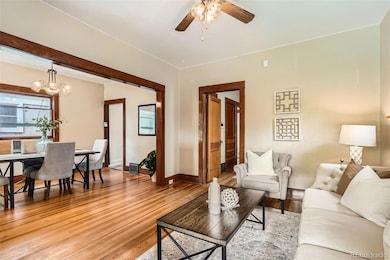
New Price! Charming Bungalow on a quiet block in West Washington Park. This well-maintained bungalow sits on a peaceful block in highly sought-after Washington Park. A beautifully kept front yard offers a warm welcome, while the classic front porch invites you to relax and watch the neighborhood go by. Inside, the cozy living and dining rooms showcase the home's original charm with rich wood floors, doors, and trim. The floorplan includes two bedrooms—one just off the living room, and the other overlooking the serene backyard. The light-filled kitchen, conveniently located off the dining room, is cheerful and functional. A full bath completes the main level. Downstairs you'll find two additional rooms. One is finished and ideal as a home office or guest space. The second houses the laundry, mechanicals, and offers excellent storage. Step outside to a spacious backyard with a patio—perfect for entertaining, gardening, or designing your personal retreat. A two-car garage adds convenience and extra storage. Major updates include a new furnace, hot water heater, and main electric panel, new kitchen stove, new copper main-water supply line—all installed in 2025. With the big-ticket items already taken care of, there's little left to do but move in and make this bungalow your own.
Listing Agent
Snyder Realty Team Brokerage Email: TOM@SNYDERTEAM.COM,303-877-3097 License #40041926 Listed on: 06/25/2025
Home Details
Home Type
- Single Family
Est. Annual Taxes
- $2,899
Year Built
- Built in 1922
Lot Details
- 4,160 Sq Ft Lot
- East Facing Home
- Partially Fenced Property
- Landscaped
- Level Lot
- Private Yard
- Property is zoned U-SU-B2
Parking
- 2 Car Garage
- Exterior Access Door
Home Design
- Bungalow
- Brick Exterior Construction
- Slab Foundation
- Frame Construction
- Composition Roof
Interior Spaces
- 1-Story Property
- Living Room
- Dining Room
- Bonus Room
- Utility Room
Kitchen
- Oven
- Range
- Dishwasher
- Disposal
Flooring
- Wood
- Carpet
Bedrooms and Bathrooms
- 2 Main Level Bedrooms
- 1 Full Bathroom
Laundry
- Dryer
- Washer
Basement
- Partial Basement
- Interior Basement Entry
Home Security
- Carbon Monoxide Detectors
- Fire and Smoke Detector
Outdoor Features
- Patio
- Front Porch
Location
- Property is near public transit
Schools
- Lincoln Elementary School
- Grant Middle School
- South High School
Utilities
- Evaporated cooling system
- Forced Air Heating System
- Heating System Uses Natural Gas
- Natural Gas Connected
- Gas Water Heater
Community Details
- No Home Owners Association
- Washington Park Subdivision
Listing and Financial Details
- Exclusions: Staging Furniture
- Assessor Parcel Number 5156-10-021
Map
Home Values in the Area
Average Home Value in this Area
Tax History
| Year | Tax Paid | Tax Assessment Tax Assessment Total Assessment is a certain percentage of the fair market value that is determined by local assessors to be the total taxable value of land and additions on the property. | Land | Improvement |
|---|---|---|---|---|
| 2024 | $2,899 | $43,300 | $15,600 | $27,700 |
| 2023 | $2,836 | $43,300 | $15,600 | $27,700 |
| 2022 | $2,393 | $37,040 | $20,000 | $17,040 |
| 2021 | $2,310 | $38,110 | $20,580 | $17,530 |
| 2020 | $1,873 | $32,400 | $19,110 | $13,290 |
| 2019 | $1,821 | $32,400 | $19,110 | $13,290 |
| 2018 | $1,932 | $32,170 | $16,290 | $15,880 |
| 2017 | $1,926 | $32,170 | $16,290 | $15,880 |
| 2016 | $1,792 | $29,930 | $14,726 | $15,204 |
| 2015 | $1,716 | $29,930 | $14,726 | $15,204 |
| 2014 | $1,465 | $25,600 | $9,027 | $16,573 |
Property History
| Date | Event | Price | List to Sale | Price per Sq Ft |
|---|---|---|---|---|
| 09/03/2025 09/03/25 | Price Changed | $689,000 | -0.6% | $674 / Sq Ft |
| 07/22/2025 07/22/25 | Price Changed | $693,000 | -0.6% | $677 / Sq Ft |
| 06/25/2025 06/25/25 | For Sale | $697,000 | -- | $681 / Sq Ft |
Purchase History
| Date | Type | Sale Price | Title Company |
|---|---|---|---|
| Warranty Deed | $219,900 | North American Title Co | |
| Warranty Deed | $162,000 | First American | |
| Quit Claim Deed | -- | -- |
Mortgage History
| Date | Status | Loan Amount | Loan Type |
|---|---|---|---|
| Open | $60,000 | No Value Available | |
| Previous Owner | $127,300 | No Value Available |
Source: REcolorado®
MLS Number: 1775118
APN: 5156-10-021
Disclaimer: Certain information contained herein is derived from information provided by parties other than Homes.com. All information provided is deemed reliable, but is not guaranteed to be accurate and should be independently verified.
![]() The content relating to real estate for sale in this Web site comes in part from the Internet Data eXchange (“IDX”) program of METROLIST, INC., DBA RECOLORADO®. Real estate listings held by brokers other than Ten-X are marked with the IDX Logo. This information is being provided for the consumers’ personal, non-commercial use and may not be used for any other purpose. All information subject to change and should be independently verified.
The content relating to real estate for sale in this Web site comes in part from the Internet Data eXchange (“IDX”) program of METROLIST, INC., DBA RECOLORADO®. Real estate listings held by brokers other than Ten-X are marked with the IDX Logo. This information is being provided for the consumers’ personal, non-commercial use and may not be used for any other purpose. All information subject to change and should be independently verified.
This publication is designed to provide information with regard to the subject matter covered. It is displayed with the understanding that the publisher and authors are not engaged in rendering real estate, legal, accounting, tax, or other professional services and that the publisher and authors are not offering such advice in this publication. If real estate, legal, or other expert assistance is required, the services of a competent, professional person should be sought.
The information contained in this publication is subject to change without notice. METROLIST, INC., DBA RECOLORADO MAKES NO WARRANTY OF ANY KIND WITH REGARD TO THIS MATERIAL, INCLUDING, BUT NOT LIMITED TO, THE IMPLIED WARRANTIES OF MERCHANTABILITY AND FITNESS FOR A PARTICULAR PURPOSE. METROLIST, INC., DBA RECOLORADO SHALL NOT BE LIABLE FOR ERRORS CONTAINED HEREIN OR FOR ANY DAMAGES IN CONNECTION WITH THE FURNISHING, PERFORMANCE, OR USE OF THIS MATERIAL.
PUBLISHER’S NOTICE: All real estate advertised herein is subject to the Federal Fair Housing Act and the Colorado Fair Housing Act, which Acts make it illegal to make or publish any advertisement that indicates any preference, limitation, or discrimination based on race, color, religion, sex, handicap, familial status, or national origin.
METROLIST, INC., DBA RECOLORADO will not knowingly accept any advertising for real estate that is in violation of the law. All persons are hereby informed that all dwellings advertised are available on an equal opportunity basis.
© 2025 METROLIST, INC., DBA RECOLORADO® – All Rights Reserved. 6455 S. Yosemite St., Suite 500 Greenwood Village, CO 80111 USA
ALL RIGHTS RESERVED WORLDWIDE. No part of this publication may be reproduced, adapted, translated, stored in a retrieval system or transmitted in any form or by any means, electronic, mechanical, photocopying, recording, or otherwise, without the prior written permission of the publisher. The information contained herein including but not limited to all text, photographs, digital images, virtual tours, may be seeded and monitored for protection and tracking.
- 130 E Ohio Ave Unit 140
- 838 S Sherman St
- 857 S Grant St
- 774 S Grant St
- 730 S Sherman St
- 646 S Lincoln St
- 794 S Pearl St
- 623 S Logan St
- 1001 S Pennsylvania St Unit 1005
- 969 S Pearl St Unit 204
- 589 S Grant St
- 571 S Sherman St
- 1056 S Pennsylvania St
- 1145 S Logan St
- 493 S Lincoln St
- 485 S Logan St Unit 11
- 465 S Lincoln St
- 981 S Emerson St
- 501 S Pearl St
- 445 S Logan St
- 918 S Logan St Unit 305
- 918 S Logan St Unit 305
- 1000 S Broadway Unit 317.1412586
- 1000 S Broadway Unit 211.1412587
- 1000 S Broadway Unit 260.1412590
- 201 E Mississippi Ave
- 1000 S Broadway
- 925 S Washington St Unit 104
- 601 S Pennsylvania St Unit ID1026265P
- 538 S Lincoln St
- 99 E Arizona St
- 1145 S Broadway
- 405 E Virginia Ave Unit 405 E. Virginia Ave.
- 441 S Logan St
- 1190 S Pennsylvania St
- 326 E Dakota Ave
- 1277 S Sherman St
- 406 S Pearl St
- 453 S Clarkson St
- 1094 S Ogden St
