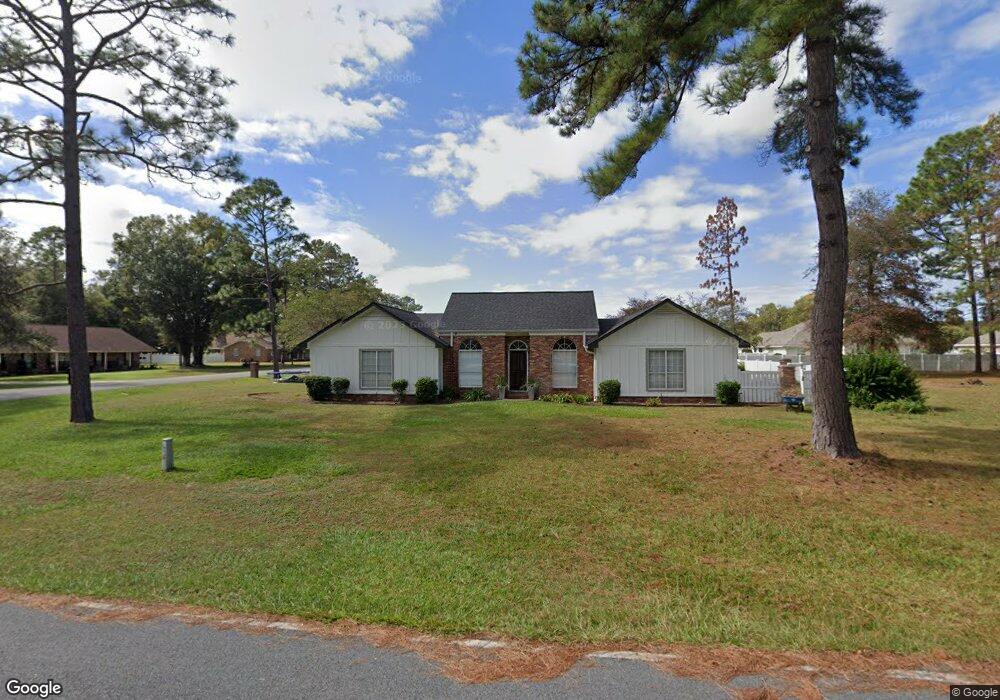
827 Saddle Cir Waycross, GA 31503
Estimated Value: $313,000 - $425,000
3
Beds
2
Baths
2,100
Sq Ft
$172/Sq Ft
Est. Value
About This Home
This home is located at 827 Saddle Cir, Waycross, GA 31503 and is currently estimated at $360,631, approximately $171 per square foot. 827 Saddle Cir is a home located in Ware County with nearby schools including Memorial Drive Elementary School, Waycross Middle School, and Ware County High School.
Ownership History
Date
Name
Owned For
Owner Type
Purchase Details
Closed on
Dec 20, 2013
Sold by
Blount Wesley T
Bought by
Mock Michael Adam and Mock Kimberly C
Current Estimated Value
Home Financials for this Owner
Home Financials are based on the most recent Mortgage that was taken out on this home.
Original Mortgage
$153,900
Outstanding Balance
$115,211
Interest Rate
4.25%
Mortgage Type
New Conventional
Estimated Equity
$245,420
Purchase Details
Closed on
Oct 18, 2007
Sold by
Blount Marlene C
Bought by
Blount Wesley T and Blount Laura N
Home Financials for this Owner
Home Financials are based on the most recent Mortgage that was taken out on this home.
Original Mortgage
$140,000
Interest Rate
6.27%
Mortgage Type
New Conventional
Purchase Details
Closed on
Jun 4, 2004
Sold by
Vanwinkle Patricia
Bought by
Blount Marlene C
Purchase Details
Closed on
Jul 24, 2003
Sold by
Blount Timothy E
Bought by
Vanwinkle Patricia
Purchase Details
Closed on
Aug 4, 1993
Bought by
Blount Timothy E
Create a Home Valuation Report for This Property
The Home Valuation Report is an in-depth analysis detailing your home's value as well as a comparison with similar homes in the area
Home Values in the Area
Average Home Value in this Area
Purchase History
| Date | Buyer | Sale Price | Title Company |
|---|---|---|---|
| Mock Michael Adam | $162,000 | -- | |
| Blount Wesley T | $175,000 | -- | |
| Blount Marlene C | $132,500 | -- | |
| Vanwinkle Patricia | $162,800 | -- | |
| Blount Timothy E | -- | -- |
Source: Public Records
Mortgage History
| Date | Status | Borrower | Loan Amount |
|---|---|---|---|
| Open | Mock Michael Adam | $153,900 | |
| Previous Owner | Blount Wesley T | $140,000 |
Source: Public Records
Tax History Compared to Growth
Tax History
| Year | Tax Paid | Tax Assessment Tax Assessment Total Assessment is a certain percentage of the fair market value that is determined by local assessors to be the total taxable value of land and additions on the property. | Land | Improvement |
|---|---|---|---|---|
| 2024 | $3,023 | $114,919 | $12,000 | $102,919 |
| 2023 | $2,958 | $84,880 | $11,500 | $73,380 |
| 2022 | $2,451 | $84,880 | $11,500 | $73,380 |
| 2021 | $2,488 | $79,313 | $11,500 | $67,813 |
| 2020 | $2,326 | $73,364 | $11,500 | $61,864 |
| 2019 | $2,244 | $69,397 | $11,500 | $57,897 |
| 2018 | $2,220 | $68,014 | $11,500 | $56,514 |
| 2017 | $2,217 | $68,014 | $11,500 | $56,514 |
| 2016 | $2,217 | $68,014 | $11,500 | $56,514 |
| 2015 | $2,199 | $66,808 | $14,000 | $52,808 |
| 2014 | $2,130 | $66,808 | $14,000 | $52,808 |
| 2013 | -- | $66,808 | $14,000 | $52,808 |
Source: Public Records
Map
Nearby Homes
- 932 Hitching Post Ln
- 851 Carriage Ln
- 627 Saddle Cir
- 664 Saddle Cir
- 606 Stonewall Jackson Place
- 716 Stonewall Jackson Place
- 1072 Lawhorne Dr
- Tract 4 County-Line Rd S
- 4155 Pinecrest Rd
- 4337 Whitehall Church Rd
- 3474 Wren Dr
- 1132 Hilltop Rd
- 4408 Brunswick Hwy
- 3153 Southwood Dr
- 6498 Central Ave
- 3070 Central Ave
- 120 Scarlett Dr
- 763 Kentland Dr
- 867 Kentland Dr
- 3735 Marvin Strickland Rd
- 826 Hitching Post Ln
- 844 Hitching Post Ln
- 700 Saddle Cir
- 808 Saddle Cir
- 846 Saddle Cir
- 853 Saddle Cir
- 852 Hitching Post Ln
- 702 Saddle Cir
- 852 Saddle Cir
- 825 Hitching Post Ln
- 841 Hitching Post Ln
- 861 Saddle Cir
- 864 Hitching Post Ln
- 514 Grace Dr
- 851 Hitching Post Ln
- 862 Saddle Cir
- 694 Saddle Cir
- 516 Grace Dr
- 0000 Hitching Post Ln
- 00 Hitching Post Ln