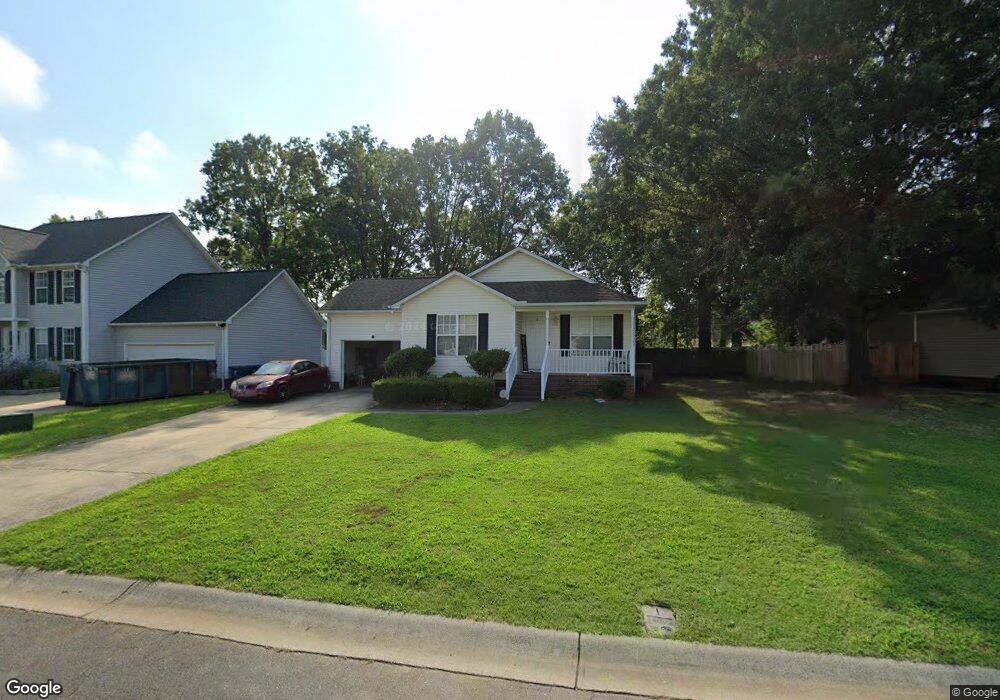
827 Saint Andrews Place Unit 39 Concord, NC 28025
Estimated Value: $295,552 - $336,000
3
Beds
2
Baths
1,295
Sq Ft
$242/Sq Ft
Est. Value
About This Home
This home is located at 827 Saint Andrews Place Unit 39, Concord, NC 28025 and is currently estimated at $313,638, approximately $242 per square foot. 827 Saint Andrews Place Unit 39 is a home located in Cabarrus County with nearby schools including Patriots Elementary School, C.C. Griffin Middle School, and Central Cabarrus High School.
Ownership History
Date
Name
Owned For
Owner Type
Purchase Details
Closed on
Oct 4, 2018
Sold by
Progress Residential Borrower 5 Llc
Bought by
Progress Residential Borrower 5 Llc
Current Estimated Value
Purchase Details
Closed on
Feb 1, 2016
Sold by
Radcliff Jason M and Radcliff Whitney L
Bought by
Freo North Carolina Llc
Purchase Details
Closed on
Mar 12, 2009
Sold by
Boyd M Katherine
Bought by
Radcliff Jason M
Home Financials for this Owner
Home Financials are based on the most recent Mortgage that was taken out on this home.
Original Mortgage
$127,350
Interest Rate
5.14%
Mortgage Type
FHA
Purchase Details
Closed on
Dec 16, 1998
Sold by
Vcc Inc
Bought by
Boyd M Katherine
Home Financials for this Owner
Home Financials are based on the most recent Mortgage that was taken out on this home.
Original Mortgage
$89,980
Interest Rate
6.9%
Mortgage Type
FHA
Create a Home Valuation Report for This Property
The Home Valuation Report is an in-depth analysis detailing your home's value as well as a comparison with similar homes in the area
Home Values in the Area
Average Home Value in this Area
Purchase History
| Date | Buyer | Sale Price | Title Company |
|---|---|---|---|
| Progress Residential Borrower 5 Llc | -- | Os National Llc | |
| Freo North Carolina Llc | $135,000 | None Available | |
| Radcliff Jason M | $130,000 | None Available | |
| Boyd M Katherine | $90,500 | -- |
Source: Public Records
Mortgage History
| Date | Status | Borrower | Loan Amount |
|---|---|---|---|
| Previous Owner | Radcliff Jason M | $127,350 | |
| Previous Owner | Boyd M Katherine | $89,980 |
Source: Public Records
Tax History Compared to Growth
Tax History
| Year | Tax Paid | Tax Assessment Tax Assessment Total Assessment is a certain percentage of the fair market value that is determined by local assessors to be the total taxable value of land and additions on the property. | Land | Improvement |
|---|---|---|---|---|
| 2025 | $2,074 | $302,340 | $61,000 | $241,340 |
| 2024 | $2,074 | $302,340 | $61,000 | $241,340 |
| 2023 | $1,481 | $174,230 | $40,000 | $134,230 |
| 2022 | $1,446 | $174,230 | $40,000 | $134,230 |
| 2021 | $1,420 | $174,230 | $40,000 | $134,230 |
| 2020 | $1,420 | $174,230 | $40,000 | $134,230 |
| 2019 | $1,046 | $128,390 | $20,000 | $108,390 |
| 2018 | $1,016 | $127,840 | $20,000 | $107,840 |
| 2017 | $965 | $127,840 | $20,000 | $107,840 |
| 2016 | $965 | $110,940 | $20,000 | $90,940 |
| 2015 | $827 | $110,940 | $20,000 | $90,940 |
| 2014 | $827 | $110,940 | $20,000 | $90,940 |
Source: Public Records
Map
Nearby Homes
- 4425 Norfleet St
- 3931 Kellybrook Dr
- 1009 Braxton Dr
- 4194 Clifftonville Ave SW
- 1051 Manston Place SW
- 1130 Brigadoon Ct
- 4175 Broadstairs Dr
- 4183 Broadstairs Dr
- 1001 Loch Lomond Cir
- 5248 Ellie Ct
- 668 Shellbark Dr
- 760 Bartram Ave Unit 114
- 5582 Flowes Store Rd
- 4285 Long Arrow Dr
- 707 Pointe Andrews Dr SW
- 876 Pointe Andrews Dr
- 5707 Saint Adriens Way
- 3560 Us Highway 601 S
- 660 Pointe Andrews Dr
- 123 Softwind Ln
- 827 Saint Andrews Place
- 831 Saint Andrews Place
- 823 Saint Andrews Place
- 834 Highlander Ct
- 838 Highlander Ct
- 835 Saint Andrews Place
- 819 Saint Andrews Place
- 832 St Andrews Place
- 824 St Andrews Place
- 830 Highlander Ct
- 842 Highlander Ct
- 832 Saint Andrews Place
- 824 Saint Andrews Place
- 839 Saint Andrews Place
- 836 Saint Andrews Place
- 815 Saint Andrews Place
- 820 Saint Andrews Place
- 826 Highlander Ct
- 846 Highlander Ct
- 840 Saint Andrews Place