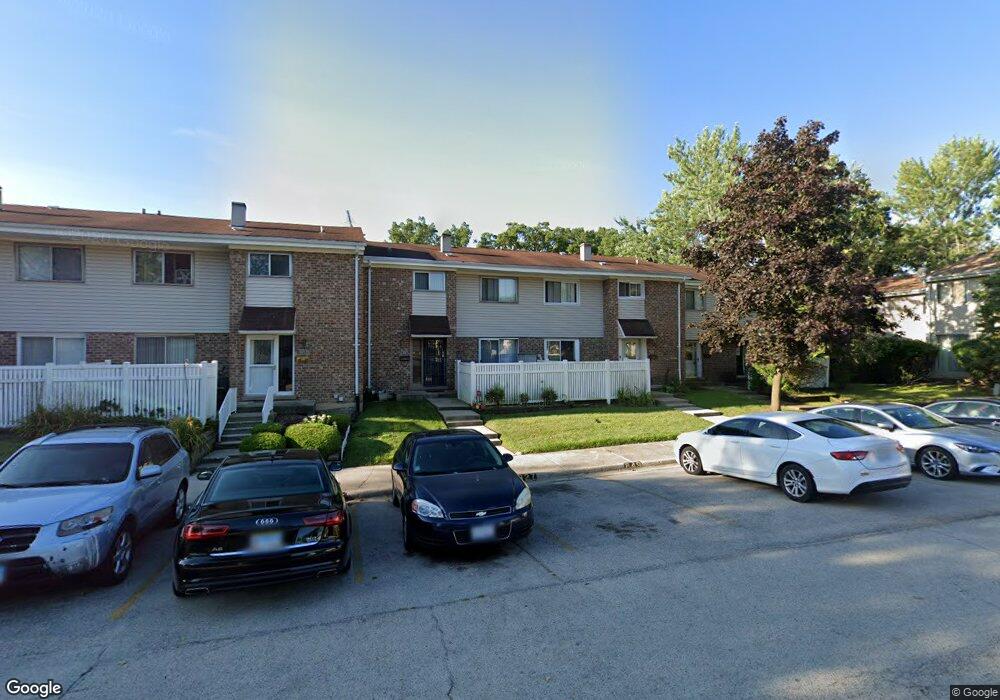
827 White Oak Ln Unit 3 University Park, IL 60484
Estimated Value: $134,000 - $211,000
3
Beds
2
Baths
1,480
Sq Ft
$114/Sq Ft
Est. Value
About This Home
This home is located at 827 White Oak Ln Unit 3, University Park, IL 60484 and is currently estimated at $168,414, approximately $113 per square foot. 827 White Oak Ln Unit 3 is a home located in Will County with nearby schools including Balmoral Elementary School, Crete-Monee Middle School, and Crete-Monee High School.
Ownership History
Date
Name
Owned For
Owner Type
Purchase Details
Closed on
Jan 31, 2002
Sold by
Coleman James E
Bought by
Schubbe Wendell E
Current Estimated Value
Home Financials for this Owner
Home Financials are based on the most recent Mortgage that was taken out on this home.
Original Mortgage
$72,265
Outstanding Balance
$30,239
Interest Rate
7.23%
Estimated Equity
$138,175
Purchase Details
Closed on
Aug 10, 2001
Sold by
Hud
Bought by
Coleman James
Home Financials for this Owner
Home Financials are based on the most recent Mortgage that was taken out on this home.
Original Mortgage
$33,600
Interest Rate
7.03%
Purchase Details
Closed on
Apr 10, 2001
Sold by
Reynolds Adrienne and Matteson Richton Bank & Trust
Bought by
Hud
Purchase Details
Closed on
Aug 17, 2000
Sold by
Reynolds Adrienne and Matteson Richton Bank & Trust
Bought by
Fleet Mtg Corp
Create a Home Valuation Report for This Property
The Home Valuation Report is an in-depth analysis detailing your home's value as well as a comparison with similar homes in the area
Home Values in the Area
Average Home Value in this Area
Purchase History
| Date | Buyer | Sale Price | Title Company |
|---|---|---|---|
| Schubbe Wendell E | $74,500 | Stewart Title Company | |
| Coleman James | -- | Stewart Title Company | |
| Hud | -- | -- | |
| Fleet Mtg Corp | -- | -- |
Source: Public Records
Mortgage History
| Date | Status | Borrower | Loan Amount |
|---|---|---|---|
| Open | Schubbe Wendell E | $72,265 | |
| Previous Owner | Coleman James | $33,600 |
Source: Public Records
Tax History Compared to Growth
Tax History
| Year | Tax Paid | Tax Assessment Tax Assessment Total Assessment is a certain percentage of the fair market value that is determined by local assessors to be the total taxable value of land and additions on the property. | Land | Improvement |
|---|---|---|---|---|
| 2024 | $3,269 | $34,045 | $2,560 | $31,485 |
| 2023 | $3,269 | $29,349 | $2,207 | $27,142 |
| 2022 | $2,727 | $25,349 | $1,941 | $23,408 |
| 2021 | $2,517 | $23,069 | $1,783 | $21,286 |
| 2020 | $2,467 | $22,321 | $1,725 | $20,596 |
| 2019 | $2,460 | $21,168 | $1,636 | $19,532 |
| 2018 | $2,530 | $21,291 | $1,597 | $19,694 |
| 2017 | $2,685 | $21,874 | $1,570 | $20,304 |
| 2016 | $2,554 | $21,074 | $1,513 | $19,561 |
| 2015 | $2,301 | $20,239 | $1,453 | $18,786 |
| 2014 | $2,301 | $19,960 | $1,433 | $18,527 |
| 2013 | $2,301 | $20,900 | $1,500 | $19,400 |
Source: Public Records
Map
Nearby Homes
- 882 White Oak Ln Unit 3
- 608 Sullivan Ln
- 820 Sandra Dr Unit 2C
- 607 Sullivan Ln
- 754 Mission Dr
- 766 Mendocino Ct Unit 3
- 903 Blackhawk Dr
- 815 Blackhawk Dr
- 1001 Blackhawk Dr
- 740 Mission St
- 807 Blackhawk Dr
- 786 Delmar Ct Unit 6
- 1031 Blackhawk Dr
- 735 Union Dr
- 708 Blackhawk Dr
- 709 Spring Ct Unit 5
- 711 Driftwood Ct
- 701 Spring Ct Unit 6
- 1116 Amherst Ln
- 524 Regent Rd
- 825 White Oak Ln Unit 2
- 829 White Oak Ln Unit 4
- 831 White Oak Ln
- 821 White Oak Ln Unit 3
- 905 White Oak Ln Unit 2
- 903 White Oak Ln
- 819 White Oak Ln Unit 2
- 899 White Oak Ln Unit 5
- 851 White Oak Ln Unit 2
- 849 White Oak Ln
- 853 White Oak Ln Unit 3
- 817 White Oak Ln Unit 1
- 833 White Oak Ln
- 847 White Oak Ln
- 909 White Oak Ln Unit 1
- 855 White Oak Ln
- 835 White Oak Ln
- 815 White Oak Ln Unit 4
- 813 White Oak Ln Unit 3
- 811 White Oak Ln