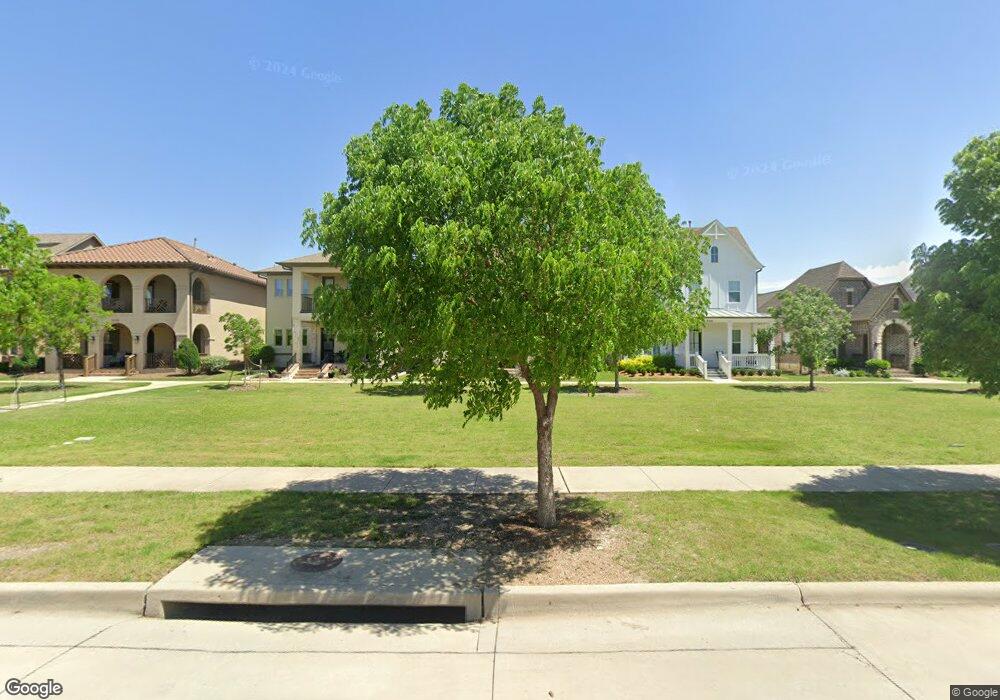
8270 Kentland Dr Frisco, TX 75034
Southwest Frisco NeighborhoodEstimated Value: $685,000 - $782,000
3
Beds
3
Baths
2,785
Sq Ft
$262/Sq Ft
Est. Value
About This Home
This home is located at 8270 Kentland Dr, Frisco, TX 75034 and is currently estimated at $729,633, approximately $261 per square foot. 8270 Kentland Dr is a home located in Denton County with nearby schools including Vaughn Elementary School, Pioneer Heritage Middle School, and Wakeland High School.
Ownership History
Date
Name
Owned For
Owner Type
Purchase Details
Closed on
Mar 3, 2020
Sold by
Grendon Emily C
Bought by
Musser Philip and Musser Teressa
Current Estimated Value
Home Financials for this Owner
Home Financials are based on the most recent Mortgage that was taken out on this home.
Original Mortgage
$341,250
Outstanding Balance
$302,796
Interest Rate
3.6%
Mortgage Type
New Conventional
Estimated Equity
$426,837
Purchase Details
Closed on
Mar 17, 2017
Sold by
Darling Homes Of Texas Llc
Bought by
Grendon Emily C
Home Financials for this Owner
Home Financials are based on the most recent Mortgage that was taken out on this home.
Original Mortgage
$300,000
Interest Rate
4.16%
Mortgage Type
New Conventional
Purchase Details
Closed on
Jun 9, 2015
Sold by
Arcadia Cgp 1 Llc
Bought by
Darling Homes Of Texas Llc
Create a Home Valuation Report for This Property
The Home Valuation Report is an in-depth analysis detailing your home's value as well as a comparison with similar homes in the area
Home Values in the Area
Average Home Value in this Area
Purchase History
| Date | Buyer | Sale Price | Title Company |
|---|---|---|---|
| Musser Philip | -- | Republic Title Of Texas | |
| Grendon Emily C | -- | None Available | |
| Darling Homes Of Texas Llc | -- | Stc |
Source: Public Records
Mortgage History
| Date | Status | Borrower | Loan Amount |
|---|---|---|---|
| Open | Musser Philip | $341,250 | |
| Previous Owner | Grendon Emily C | $300,000 |
Source: Public Records
Tax History Compared to Growth
Tax History
| Year | Tax Paid | Tax Assessment Tax Assessment Total Assessment is a certain percentage of the fair market value that is determined by local assessors to be the total taxable value of land and additions on the property. | Land | Improvement |
|---|---|---|---|---|
| 2025 | $8,511 | $655,964 | $134,187 | $542,813 |
| 2024 | $9,960 | $596,331 | $0 | $0 |
| 2023 | $7,446 | $542,119 | $121,702 | $578,298 |
| 2022 | $9,251 | $492,835 | $129,787 | $461,502 |
| 2021 | $8,879 | $448,032 | $109,989 | $338,043 |
| 2020 | $8,777 | $436,636 | $109,989 | $326,647 |
| 2019 | $9,509 | $450,197 | $109,989 | $340,208 |
| 2018 | $10,270 | $478,902 | $109,989 | $368,913 |
| 2017 | $8,260 | $382,680 | $109,989 | $272,691 |
| 2016 | $8,206 | $55,435 | $55,435 | $0 |
| 2015 | -- | $38,012 | $38,012 | $0 |
Source: Public Records
Map
Nearby Homes
- 3865 Sevilla Dr
- 4173 Wellesley Ave
- 3945 Wellesley Ave
- 8086 Ashcroft Ln
- 7919 Canal St
- 4280 Wellesley Ave
- 4184 Curtiss Dr
- 3658 Copper Point Ln
- 4253 Sechrist Dr
- 3857 Mashpee St
- 8977 George Cayley Ln
- 3644 Benchmark Ln
- 9129 Apollo Ct
- 3383 High Shoals Dr
- 9117 Bastille Way
- 3360 Country Glen Trail
- 3506 Evita Dr
- 3250 Woodbine Trail
- 3259 Cedar Creek Trail
- 7132 Jernigan Dr
- 8292 Kentland Dr
- 8248 Kentland Dr
- 8230 Kentland Dr
- 8314 Kentland Dr
- 8279 Canal St
- 8293 Canal St
- 8265 Canal St
- 8336 Kentland Dr
- 8251 Canal St
- 8212 Kentland Dr
- 8301 Canal St
- 8301 Canal St
- 8237 Canal St
- 8317 Canal St
- 8317 Canal St
- 8223 Canal St
- 8223 Canal St
- 8358 Kentland Dr
- 8331 Canal St
- 8358 Kentland Dr