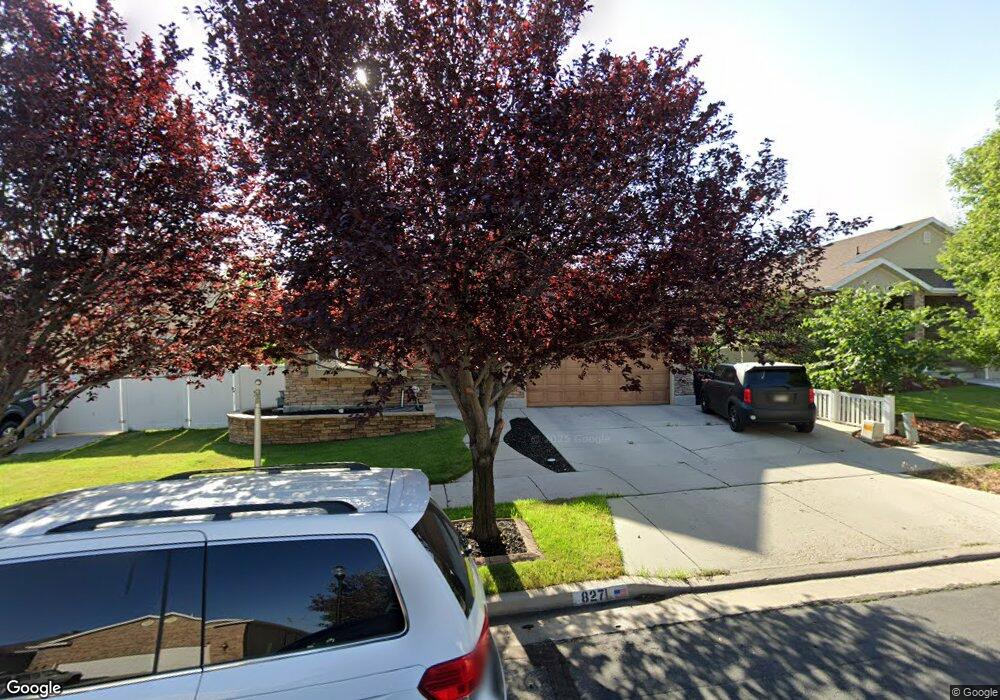
8271 S 6335 W West Jordan, UT 84081
Jordan Hills NeighborhoodEstimated Value: $575,000 - $620,000
3
Beds
2
Baths
1,719
Sq Ft
$348/Sq Ft
Est. Value
About This Home
This home is located at 8271 S 6335 W, West Jordan, UT 84081 and is currently estimated at $597,530, approximately $347 per square foot. 8271 S 6335 W is a home located in Salt Lake County with nearby schools including Fox Hollow School, Sunset Ridge Middle School, and Copper Hills High School.
Ownership History
Date
Name
Owned For
Owner Type
Purchase Details
Closed on
Jan 13, 2014
Sold by
Hegstrom Josh and Hegstrom Denise
Bought by
Hegstrom Josh and The Josh Hegstrom Trust
Current Estimated Value
Purchase Details
Closed on
Sep 23, 2013
Sold by
The Joshua Hegstrom Trust Joshua
Bought by
Hegstrom Joshua and Hegstrom Denise
Purchase Details
Closed on
Aug 6, 2009
Sold by
Hegstrom Josh and Hegstrom Denise
Bought by
Hegstrom Joshua
Purchase Details
Closed on
Oct 7, 2004
Sold by
Richmond American Homes Of Utah Inc
Bought by
Hegstrom Josh and Hegstrom Denise
Home Financials for this Owner
Home Financials are based on the most recent Mortgage that was taken out on this home.
Original Mortgage
$178,463
Outstanding Balance
$88,384
Interest Rate
5.77%
Mortgage Type
FHA
Estimated Equity
$509,146
Create a Home Valuation Report for This Property
The Home Valuation Report is an in-depth analysis detailing your home's value as well as a comparison with similar homes in the area
Home Values in the Area
Average Home Value in this Area
Purchase History
| Date | Buyer | Sale Price | Title Company |
|---|---|---|---|
| Hegstrom Josh | -- | None Available | |
| Hegstrom Joshua | -- | None Available | |
| Hegstrom Joshua | -- | None Available | |
| Hegstrom Josh | -- | First American Title |
Source: Public Records
Mortgage History
| Date | Status | Borrower | Loan Amount |
|---|---|---|---|
| Open | Hegstrom Josh | $178,463 |
Source: Public Records
Tax History Compared to Growth
Tax History
| Year | Tax Paid | Tax Assessment Tax Assessment Total Assessment is a certain percentage of the fair market value that is determined by local assessors to be the total taxable value of land and additions on the property. | Land | Improvement |
|---|---|---|---|---|
| 2025 | $2,861 | $569,700 | $133,400 | $436,300 |
| 2024 | $2,861 | $550,400 | $128,900 | $421,500 |
| 2023 | $2,928 | $531,000 | $126,400 | $404,600 |
| 2022 | $2,998 | $534,800 | $123,900 | $410,900 |
| 2021 | $2,411 | $391,500 | $98,300 | $293,200 |
| 2020 | $2,285 | $348,300 | $98,300 | $250,000 |
| 2019 | $2,238 | $334,500 | $98,300 | $236,200 |
| 2018 | $2,103 | $311,700 | $95,400 | $216,300 |
| 2017 | $1,975 | $291,400 | $95,400 | $196,000 |
| 2016 | $1,882 | $260,900 | $95,400 | $165,500 |
| 2015 | $1,874 | $253,400 | $97,200 | $156,200 |
| 2014 | $1,793 | $238,600 | $92,700 | $145,900 |
Source: Public Records
Map
Nearby Homes
- 8356 S Four Elm Cir
- 8329 S 6430 W
- 8368 S Oak Gate Dr
- 6466 W Pin Oak Dr
- 8246 S Oak Acorn Ct
- 8457 S 6430 W
- 8269 S 6555 W
- 6543 W Oak Bridge Dr
- 8014 Overton Dr
- 8497 S 6465 W
- 7622 Iron Canyon Unit 343
- 7628 S Clipper Hill Rd W Unit 303
- 7068 W Terrain Rd Unit 163
- 6819 S Clever Peak Dr Unit 272
- 8953 S Smoky Hollow Rd
- 5973 W Hal Row Unit 112
- 8043 S Ambrosia Ln
- 8559 Sunrise Oak Dr
- Clarke 2 Plan at Addenbrook Townhomes
- 6343 W 7900 S
- 8261 S 6335 W
- 8281 S 6335 W
- 8272 S 6290 W
- 8251 S 6335 W
- 8291 S 6335 W
- 8262 S 6290 W
- 8282 S 6290 W
- 8274 S 6335 W
- 8252 S 6290 W
- 8292 S 6290 W
- 8264 S 6335 W
- 8288 S 6335 W
- 8241 S 6335 W
- 8254 S Meadow Dr
- 8254 S 6335 W
- 6324 Imperial Oak Dr
- 6324 W Imperial Oak Dr
- 6314 Imperial Oak Dr
- 6314 W Imperial Oak Dr
- 8296 S 6335 W