8275 Minots Ledge Ave Las Vegas, NV 89147
Rancho Viejo NeighborhoodEstimated Value: $545,951 - $598,000
4
Beds
3
Baths
1,911
Sq Ft
$294/Sq Ft
Est. Value
About This Home
This home is located at 8275 Minots Ledge Ave, Las Vegas, NV 89147 and is currently estimated at $562,738, approximately $294 per square foot. 8275 Minots Ledge Ave is a home with nearby schools including Frank Kim Elementary School, Clifford J Lawrence Junior High School, and Spring Valley High School.
Ownership History
Date
Name
Owned For
Owner Type
Purchase Details
Closed on
Jan 20, 2022
Sold by
Yoshida Colleen M
Bought by
Ad Trust
Current Estimated Value
Purchase Details
Closed on
May 15, 2020
Sold by
Yoshida Colleen M
Bought by
Yoshida Colleen M
Home Financials for this Owner
Home Financials are based on the most recent Mortgage that was taken out on this home.
Original Mortgage
$262,500
Interest Rate
3.3%
Mortgage Type
New Conventional
Purchase Details
Closed on
Jun 6, 2014
Sold by
D R Horton Inc
Bought by
Yoshida Colleen M
Home Financials for this Owner
Home Financials are based on the most recent Mortgage that was taken out on this home.
Original Mortgage
$292,937
Interest Rate
4.16%
Mortgage Type
New Conventional
Purchase Details
Closed on
May 30, 2014
Sold by
Duesman Douglas J
Bought by
Yoshida Colleen M
Home Financials for this Owner
Home Financials are based on the most recent Mortgage that was taken out on this home.
Original Mortgage
$292,937
Interest Rate
4.16%
Mortgage Type
New Conventional
Create a Home Valuation Report for This Property
The Home Valuation Report is an in-depth analysis detailing your home's value as well as a comparison with similar homes in the area
Home Values in the Area
Average Home Value in this Area
Purchase History
| Date | Buyer | Sale Price | Title Company |
|---|---|---|---|
| Ad Trust | -- | Jones Lobello Pllc | |
| Yoshida Colleen M | -- | Mortgage Connect Lp Ven | |
| Yoshida Colleen M | $308,355 | Dhi Title Of Nevada | |
| Yoshida Colleen M | -- | Dhi Title Of Nevada |
Source: Public Records
Mortgage History
| Date | Status | Borrower | Loan Amount |
|---|---|---|---|
| Previous Owner | Yoshida Colleen M | $262,500 | |
| Previous Owner | Yoshida Colleen M | $292,937 |
Source: Public Records
Tax History Compared to Growth
Tax History
| Year | Tax Paid | Tax Assessment Tax Assessment Total Assessment is a certain percentage of the fair market value that is determined by local assessors to be the total taxable value of land and additions on the property. | Land | Improvement |
|---|---|---|---|---|
| 2025 | $3,170 | $156,931 | $46,200 | $110,731 |
| 2024 | $3,079 | $156,931 | $46,200 | $110,731 |
| 2023 | $2,512 | $147,405 | $43,750 | $103,655 |
| 2022 | $2,989 | $131,721 | $37,100 | $94,621 |
| 2021 | $2,902 | $121,916 | $32,550 | $89,366 |
| 2020 | $2,815 | $118,912 | $30,800 | $88,112 |
| 2019 | $2,733 | $116,211 | $29,750 | $86,461 |
| 2018 | $2,653 | $107,159 | $24,150 | $83,009 |
| 2017 | $3,168 | $108,011 | $24,150 | $83,861 |
| 2016 | $2,512 | $101,355 | $20,650 | $80,705 |
| 2015 | $2,759 | $86,214 | $16,450 | $69,764 |
| 2014 | $2,385 | $11,200 | $11,200 | $0 |
Source: Public Records
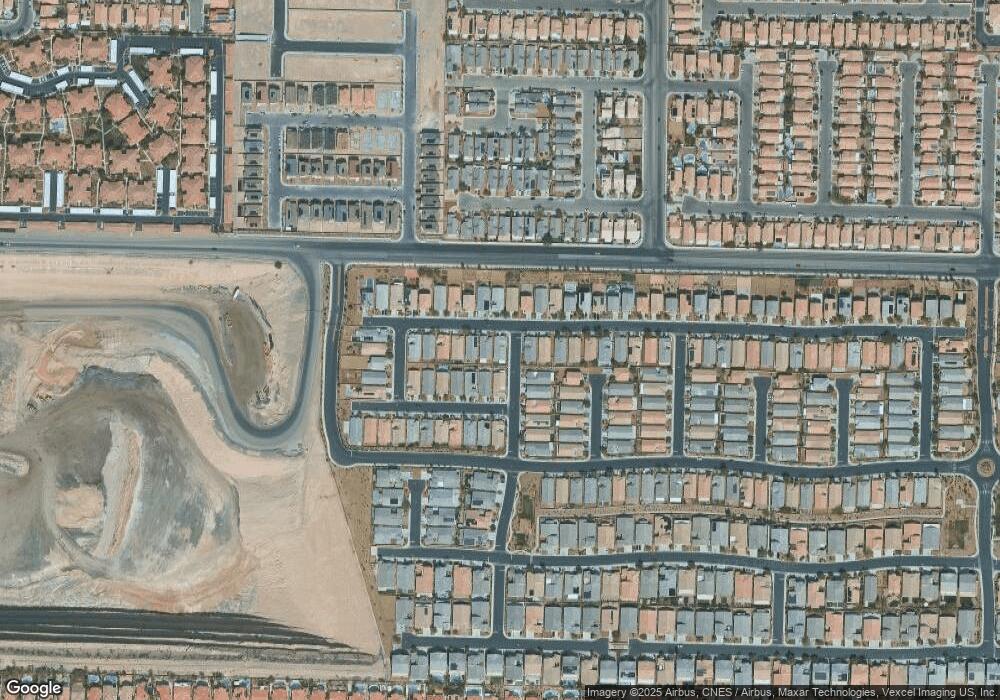
Map
Nearby Homes
- 8305 Minots Ledge Ave
- 4589 Cedar Island Ct
- 4454 Bertram Ln
- 8369 Aurora Ridge Ave
- 8217 Beekman St
- 4557 Rockland Break Ct
- 8333 W Rochelle Ave
- Kingsbury Plan at Sienna Ridge
- Bellevue NextGen Plan at Sienna Ridge
- Skyland Plan at Sienna Ridge
- Glenbrook Plan at Sienna Ridge
- Mitchell NextGen Plan at Sienna Ridge
- 8373 Rochelle Ave
- 8379 Rochelle Ave
- 4411 Elk Point Cir
- 8137 Cape Flattery Ave
- 8187 W Rochelle Ave
- 8397 W Rochelle Ave
- 4404 Elk Point Cir Unit 6
- 8065 Cimarron Meadows Way
- 8281 Minots Ledge Ave
- 8287 Minots Ledge Ave
- 8263 Minots Ledge Ave
- 8276 Spectacle Reef Ave
- 8282 Spectacle Reef Ave
- 8293 Minots Ledge Ave
- 8288 Spectacle Reef Ave
- 8257 Minots Ledge Ave
- 4554 White Cap Mill St
- 8284 Minots Ledge Ave
- 8266 Minots Ledge Ave
- 8294 Spectacle Reef Ave
- 8278 Minots Ledge Ave
- 8299 Minots Ledge Ave
- 8272 Minots Ledge Ave
- 8290 Minots Ledge Ave
- 8251 Minots Ledge Ave
- 8260 Minots Ledge Ave
- 8300 Spectacle Reef Ave
- 4570 White Cap Mill St