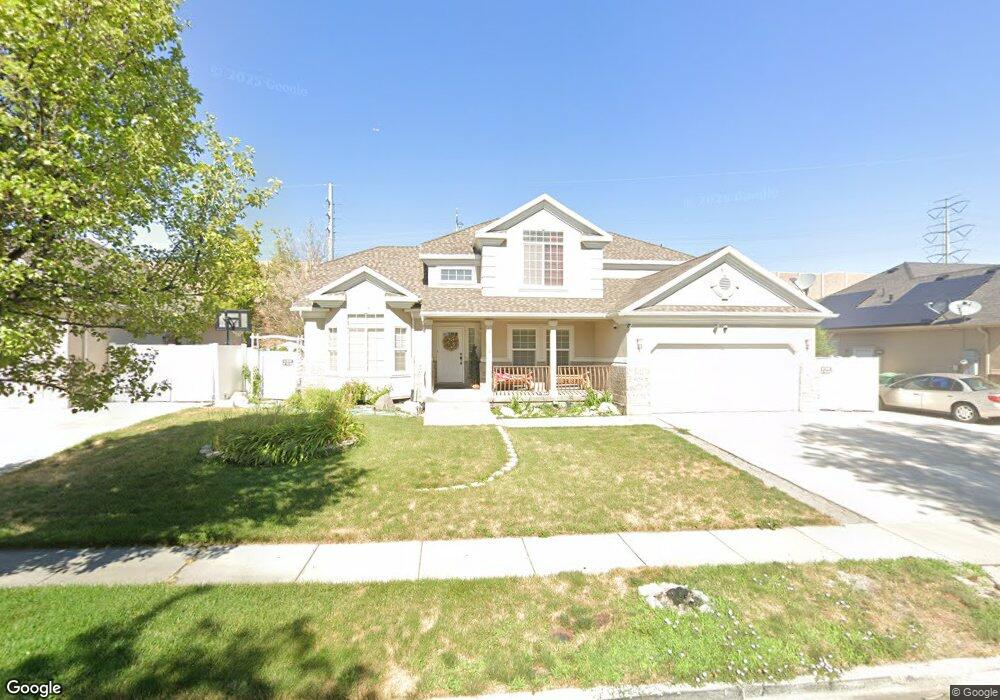
8278 S Meadow Estates Dr West Jordan, UT 84081
Cobble Creek NeighborhoodEstimated Value: $698,000 - $784,000
6
Beds
4
Baths
3,923
Sq Ft
$184/Sq Ft
Est. Value
About This Home
This home is located at 8278 S Meadow Estates Dr, West Jordan, UT 84081 and is currently estimated at $722,783, approximately $184 per square foot. 8278 S Meadow Estates Dr is a home located in Salt Lake County with nearby schools including Hayden Peak Elementary School, West Hills Middle School, and Copper Hills High School.
Ownership History
Date
Name
Owned For
Owner Type
Purchase Details
Closed on
May 20, 2024
Sold by
Arnold Matthew and Arnold Clareen
Bought by
Arnold Family Trust and Arnold
Current Estimated Value
Purchase Details
Closed on
Mar 12, 2020
Sold by
Ihler Alan E and Ihler Dorothy L
Bought by
Arnold Matthew and Arnold Clareen
Home Financials for this Owner
Home Financials are based on the most recent Mortgage that was taken out on this home.
Original Mortgage
$475,000
Interest Rate
3.4%
Mortgage Type
New Conventional
Purchase Details
Closed on
Jul 5, 2006
Sold by
Ivory Homes Ltd
Bought by
Ihler Alan E and Ihler Dorothy L
Home Financials for this Owner
Home Financials are based on the most recent Mortgage that was taken out on this home.
Original Mortgage
$45,000
Interest Rate
6.23%
Mortgage Type
Stand Alone Second
Create a Home Valuation Report for This Property
The Home Valuation Report is an in-depth analysis detailing your home's value as well as a comparison with similar homes in the area
Home Values in the Area
Average Home Value in this Area
Purchase History
| Date | Buyer | Sale Price | Title Company |
|---|---|---|---|
| Arnold Family Trust | -- | None Listed On Document | |
| Arnold Matthew | -- | Title Guarantee Fort Union | |
| Ihler Alan E | -- | Cottonwood Title Ins Agency |
Source: Public Records
Mortgage History
| Date | Status | Borrower | Loan Amount |
|---|---|---|---|
| Previous Owner | Arnold Matthew | $475,000 | |
| Previous Owner | Ihler Alan E | $45,000 | |
| Previous Owner | Ihler Alan E | $240,200 |
Source: Public Records
Tax History Compared to Growth
Tax History
| Year | Tax Paid | Tax Assessment Tax Assessment Total Assessment is a certain percentage of the fair market value that is determined by local assessors to be the total taxable value of land and additions on the property. | Land | Improvement |
|---|---|---|---|---|
| 2025 | $3,373 | $668,800 | $142,700 | $526,100 |
| 2024 | $3,373 | $648,900 | $138,500 | $510,400 |
| 2023 | $3,408 | $617,900 | $133,200 | $484,700 |
| 2022 | $3,543 | $632,100 | $130,600 | $501,500 |
| 2021 | $2,987 | $485,100 | $102,900 | $382,200 |
| 2020 | $2,371 | $361,300 | $102,900 | $258,400 |
| 2019 | $2,397 | $358,200 | $102,900 | $255,300 |
| 2018 | $2,259 | $334,800 | $101,200 | $233,600 |
| 2017 | $2,132 | $314,700 | $101,200 | $213,500 |
| 2016 | $2,091 | $289,900 | $98,800 | $191,100 |
| 2015 | $2,070 | $279,900 | $100,600 | $179,300 |
| 2014 | $1,878 | $250,000 | $91,200 | $158,800 |
Source: Public Records
Map
Nearby Homes
- 5746 W Swift Creek Rd
- 5719 W Boulder Creek Rd
- 5946 W Eric Mountain Ln Unit 103
- 5946 W Eric Mountain Ln
- 5958 W 8100 S
- 5958 W Eric Mountain Ln
- 5958 W Eric Mountain Ln Unit 104
- 8524 S Michele River Ave
- Larsen Plan at Copperhaven by Toll Brothers
- Brooke Plan at Copperhaven by Toll Brothers
- 5702 W Sophia Brook Ln
- 8501 S Michele River Ave
- 8501 S Michele River Ave Unit 116
- 6031 W Highlandbrook Dr
- Clarke 2 Plan at Addenbrook Townhomes
- 6006 W Highlandbrook Dr
- 5422 W Island Creek Dr
- 8453 S Windmill Dr
- 8368 S Oak Gate Dr
- 6036 W Sapphire St
- 8278 Meadow Estates Dr
- 8292 S Meadow Estates Dr
- 8266 S Meadow Estates Dr
- 8266 Meadow Estates Dr
- 8292 Meadow Estates Dr
- 8254 S Meadow Estates Dr
- 8254 Meadow Estates Dr
- 5742 Mirror Lake Dr
- 5743 W Field Creek Way
- 8302 S Meadow Estates Dr
- 5743 W Field Creek Way
- 8302 S Meadow Estates Dr
- 8246 Meadow Estates Dr
- 8246 S Meadow Estates Dr
- 5736 W Mirror Lake Dr
- 5736 Mirror Lake Dr
- 5747 Mirror Lake Dr
- 5733 W Field Creek Way
- 5733 W Field Creek Way
- 5744 Field Creek Way