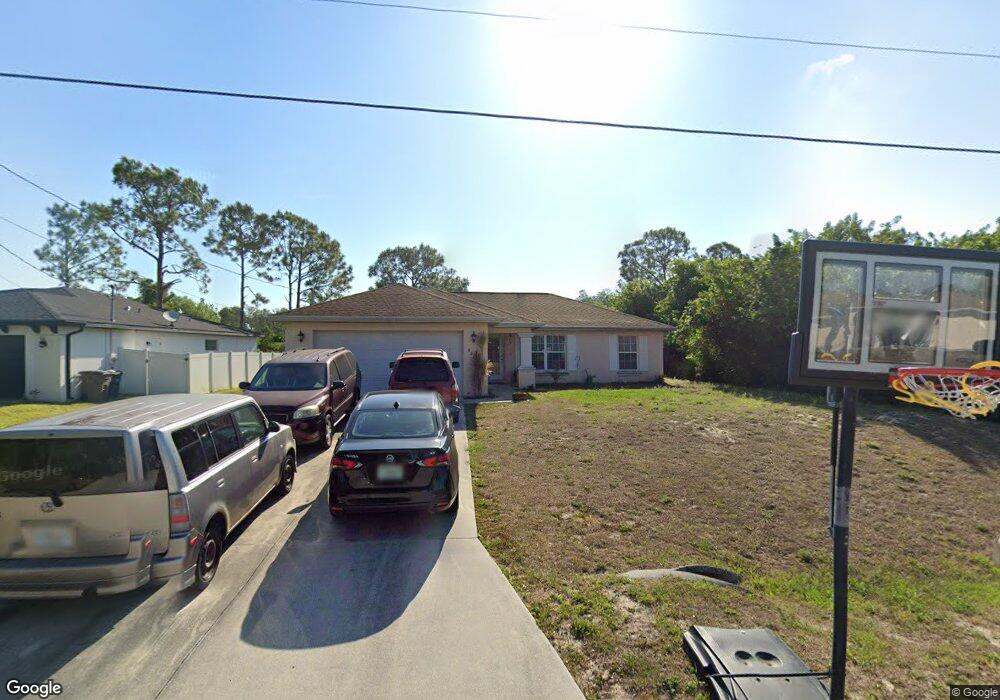
828 Angelo Ave Unit 9 Lehigh Acres, FL 33971
Centennial NeighborhoodEstimated Value: $200,000 - $304,000
3
Beds
2
Baths
1,272
Sq Ft
$205/Sq Ft
Est. Value
About This Home
This home is located at 828 Angelo Ave Unit 9, Lehigh Acres, FL 33971 and is currently estimated at $261,374, approximately $205 per square foot. 828 Angelo Ave Unit 9 is a home located in Lee County with nearby schools including Gateway Elementary School, Lehigh Elementary School, and Tice Elementary School.
Ownership History
Date
Name
Owned For
Owner Type
Purchase Details
Closed on
Jul 22, 2009
Sold by
National Credit Union Administration
Bought by
Strunk Shannon
Current Estimated Value
Home Financials for this Owner
Home Financials are based on the most recent Mortgage that was taken out on this home.
Original Mortgage
$57,931
Outstanding Balance
$37,925
Interest Rate
5.37%
Mortgage Type
FHA
Estimated Equity
$223,449
Purchase Details
Closed on
Apr 4, 2008
Sold by
Martinez Osniel J
Bought by
National Credit Union Administration Boa and Norlarco Credit Union
Purchase Details
Closed on
Aug 30, 2005
Sold by
K Hovnanian First Homes Llc
Bought by
Martinez Osniel J
Home Financials for this Owner
Home Financials are based on the most recent Mortgage that was taken out on this home.
Original Mortgage
$208,481
Interest Rate
5.71%
Mortgage Type
Construction
Create a Home Valuation Report for This Property
The Home Valuation Report is an in-depth analysis detailing your home's value as well as a comparison with similar homes in the area
Home Values in the Area
Average Home Value in this Area
Purchase History
| Date | Buyer | Sale Price | Title Company |
|---|---|---|---|
| Strunk Shannon | $59,000 | Realty Title Solutions Lllp | |
| National Credit Union Administration Boa | $102,000 | Srs Title Services Inc | |
| Martinez Osniel J | $88,900 | First Home Title |
Source: Public Records
Mortgage History
| Date | Status | Borrower | Loan Amount |
|---|---|---|---|
| Open | Strunk Shannon | $57,931 | |
| Previous Owner | Martinez Osniel J | $208,481 |
Source: Public Records
Tax History
| Year | Tax Paid | Tax Assessment Tax Assessment Total Assessment is a certain percentage of the fair market value that is determined by local assessors to be the total taxable value of land and additions on the property. | Land | Improvement |
|---|---|---|---|---|
| 2025 | $2,922 | $167,841 | -- | -- |
| 2024 | $2,486 | $152,583 | -- | -- |
| 2023 | $2,775 | $138,712 | $0 | $0 |
| 2022 | $2,486 | $126,102 | $0 | $0 |
| 2021 | $2,122 | $136,461 | $11,000 | $125,461 |
| 2020 | $2,041 | $127,583 | $9,000 | $118,583 |
| 2019 | $2,043 | $127,592 | $7,000 | $120,592 |
Source: Public Records
Map
Nearby Homes
- 900 Angelo Ave
- 830 Angelo Ave
- 5006 Barth St
- 1015 Agnes Ave
- 820 Acton Ave
- 4906 Brookfield St
- 5000 Bygone St
- 5002 Bygone St
- 5312 Bygone St
- 5004 Bygone St
- 817 Atherton Ave
- 5005 Bywood St
- 5206 Beauty St
- 900 Anson Ave
- 1125 Anza Ave
- 1005 Angelo Ave
- 909 Adeline Ave
- 5201 Brookfield St
- 829 Alido Ave
- 1010 Angelo Ave
- 829 Angelo Ave
- 827 Angelo Ave
- 825 Anza Ave
- 902 Angelo Ave Unit 9
- 5304 Banning St
- 903 Anza Ave
- 5521 Barth St
- 5010 Barth St
- 5216 Barth St
- 5214 Barth St
- 5210 Barth St
- 5208 Barth St
- 5534 Banning St
- 5016 Banning St
- 5302 Banning St
- 5000 Banning St
- 5514 Banning St
- 824 Anson Ave
- 906 Angelo Ave Unit 9
- 828 Anza Ave
Your Personal Tour Guide
Ask me questions while you tour the home.