Estimated Value: $357,193 - $394,000
3
Beds
3
Baths
2,318
Sq Ft
$161/Sq Ft
Est. Value
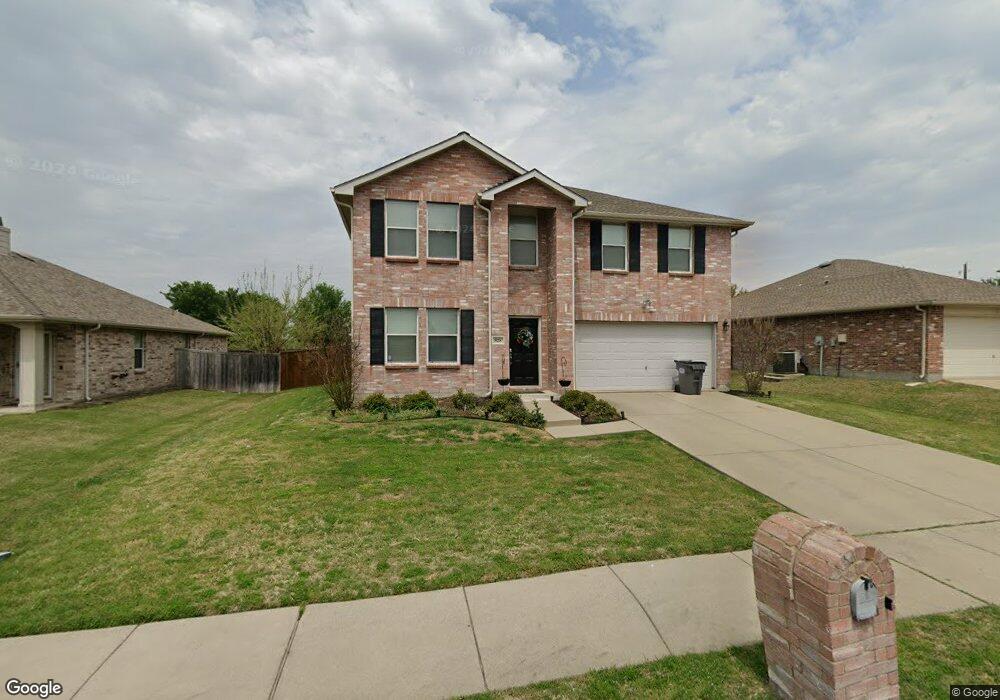
About This Home
This home is located at 828 Bessemer Dr, Wylie, TX 75098 and is currently estimated at $372,798, approximately $160 per square foot. 828 Bessemer Dr is a home located in Collin County with nearby schools including Dodd Elementary School, Frank Mcmillan Junior High School, and Davis Intermediate School.
Ownership History
Date
Name
Owned For
Owner Type
Purchase Details
Closed on
Apr 30, 2008
Sold by
Nationstar Mortgage Llc
Bought by
Plains Daralyn A
Current Estimated Value
Home Financials for this Owner
Home Financials are based on the most recent Mortgage that was taken out on this home.
Original Mortgage
$138,450
Outstanding Balance
$87,588
Interest Rate
5.86%
Mortgage Type
Purchase Money Mortgage
Estimated Equity
$285,210
Purchase Details
Closed on
Aug 8, 2007
Sold by
Najera Dora Leticia
Bought by
Nationstar Mortgage Llc
Purchase Details
Closed on
Mar 17, 2005
Sold by
Centex Homes
Bought by
Najera Dora Leticia
Home Financials for this Owner
Home Financials are based on the most recent Mortgage that was taken out on this home.
Original Mortgage
$115,013
Interest Rate
8.1%
Mortgage Type
Fannie Mae Freddie Mac
Create a Home Valuation Report for This Property
The Home Valuation Report is an in-depth analysis detailing your home's value as well as a comparison with similar homes in the area
Home Values in the Area
Average Home Value in this Area
Purchase History
| Date | Buyer | Sale Price | Title Company |
|---|---|---|---|
| Plains Daralyn A | -- | None Available | |
| Nationstar Mortgage Llc | $31,076 | None Available | |
| Najera Dora Leticia | -- | -- |
Source: Public Records
Mortgage History
| Date | Status | Borrower | Loan Amount |
|---|---|---|---|
| Open | Plains Daralyn A | $138,450 | |
| Previous Owner | Najera Dora Leticia | $115,013 | |
| Closed | Najera Dora Leticia | $28,753 |
Source: Public Records
Tax History Compared to Growth
Tax History
| Year | Tax Paid | Tax Assessment Tax Assessment Total Assessment is a certain percentage of the fair market value that is determined by local assessors to be the total taxable value of land and additions on the property. | Land | Improvement |
|---|---|---|---|---|
| 2025 | $5,620 | $369,521 | $95,000 | $274,521 |
| 2024 | $5,620 | $352,008 | $95,000 | $255,000 |
| 2023 | $5,620 | $320,007 | $80,000 | $273,835 |
| 2022 | $6,382 | $290,915 | $80,000 | $239,597 |
| 2021 | $6,223 | $264,468 | $65,000 | $199,468 |
| 2020 | $6,010 | $242,040 | $55,000 | $187,040 |
| 2019 | $6,264 | $238,365 | $55,000 | $195,000 |
| 2018 | $5,836 | $216,695 | $55,000 | $187,000 |
| 2017 | $5,305 | $232,556 | $50,000 | $182,556 |
| 2016 | $4,976 | $200,677 | $40,000 | $160,677 |
| 2015 | $4,033 | $162,805 | $35,000 | $127,805 |
Source: Public Records
Map
Nearby Homes
- 626 Gunters Mountain Ln
- 1305 Mobile Ln
- 713 Kinston Ct
- 2049 Quail Run Rd
- 705 Baldwin Rd
- 902 Greene Way
- 1306 Ardmore Way
- 908 Greene Way
- 1003 Ann Dr
- 1203 Madison Dr
- 1312 Meziere Sky Dr
- 907 Carlton Rd
- 704 Beau Dr
- 1428 Mars Lander Ln
- 913 Chickesaw Ln
- 610 Beau Dr
- 1426 Mars Lander Ln
- 1430 Mars Lander Ln
- 1432 Mars Lander Ln
- 1434 Mars Lander Ln
- 830 Bessemer Dr
- 826 Bessemer Dr
- 824 Bessemer Dr
- 832 Bessemer Dr
- 832 Bessemer Dr
- 724 Odenville Dr
- 725 Hanceville Way
- 822 Bessemer Dr
- 722 Odenville Dr
- 723 Hanceville Way
- 820 Bessemer Dr
- 720 Odenville Dr
- 724 Hanceville Way
- 721 Hanceville Way
- 818 Bessemer Dr
- 722 Hanceville Way
- 718 Odenville Dr
- 719 Hanceville Way
- 816 Bessemer Dr
- 817 Bessemer Dr