Estimated Value: $157,000 - $172,000
3
Beds
1
Bath
1,025
Sq Ft
$158/Sq Ft
Est. Value
About This Home
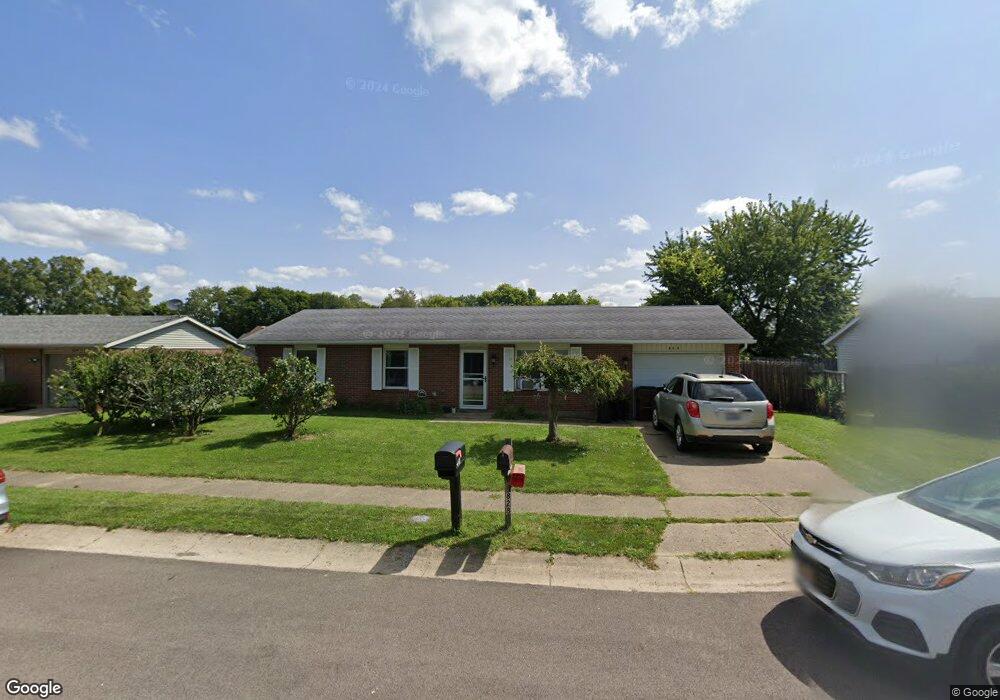
This home is located at 828 Cypress Ln, Eaton, OH 45320 and is currently estimated at $162,410, approximately $158 per square foot. 828 Cypress Ln is a home located in Preble County with nearby schools including Hollingsworth East Elementary School, William Bruce Elementary School, and Eaton Middle School.
Ownership History
Date
Name
Owned For
Owner Type
Purchase Details
Closed on
Mar 24, 2017
Bought by
Emma Pansing
Current Estimated Value
Purchase Details
Closed on
Apr 13, 2007
Sold by
Howard Wilmer and Howard Mary M
Bought by
Pansing Jack and Pansing Emma
Home Financials for this Owner
Home Financials are based on the most recent Mortgage that was taken out on this home.
Original Mortgage
$47,000
Interest Rate
6.2%
Mortgage Type
Purchase Money Mortgage
Purchase Details
Closed on
Dec 8, 2006
Sold by
Howard Elmer
Bought by
Howard Wilmer and Howard Mary M
Purchase Details
Closed on
Feb 9, 1996
Sold by
Frizzell Const Inc
Bought by
Howard Elmer
Home Financials for this Owner
Home Financials are based on the most recent Mortgage that was taken out on this home.
Original Mortgage
$66,500
Interest Rate
6.75%
Mortgage Type
New Conventional
Create a Home Valuation Report for This Property
The Home Valuation Report is an in-depth analysis detailing your home's value as well as a comparison with similar homes in the area
Home Values in the Area
Average Home Value in this Area
Purchase History
| Date | Buyer | Sale Price | Title Company |
|---|---|---|---|
| Emma Pansing | -- | -- | |
| Pansing Jack | $77,000 | Freedom Title Co Inc | |
| Howard Wilmer | $62,600 | None Available | |
| Howard Elmer | $66,500 | -- |
Source: Public Records
Mortgage History
| Date | Status | Borrower | Loan Amount |
|---|---|---|---|
| Previous Owner | Pansing Jack | $47,000 | |
| Previous Owner | Howard Elmer | $66,500 |
Source: Public Records
Tax History Compared to Growth
Tax History
| Year | Tax Paid | Tax Assessment Tax Assessment Total Assessment is a certain percentage of the fair market value that is determined by local assessors to be the total taxable value of land and additions on the property. | Land | Improvement |
|---|---|---|---|---|
| 2024 | $1,764 | $45,440 | $5,710 | $39,730 |
| 2023 | $1,290 | $45,440 | $5,710 | $39,730 |
| 2022 | $858 | $27,550 | $4,130 | $23,420 |
| 2021 | $903 | $27,550 | $4,130 | $23,420 |
| 2020 | $872 | $27,550 | $4,130 | $23,420 |
| 2019 | $679 | $22,790 | $3,570 | $19,220 |
| 2018 | $695 | $22,790 | $3,570 | $19,220 |
| 2017 | $275 | $22,790 | $3,570 | $19,220 |
| 2016 | $549 | $20,270 | $3,470 | $16,800 |
| 2014 | $283 | $20,270 | $3,470 | $16,800 |
| 2013 | $690 | $22,995 | $3,465 | $19,530 |
Source: Public Records
Map
Nearby Homes
- 335 Frizzell Ave
- 325 Chestnut Dr
- 3525 South St
- 301 E Saint Clair St
- 219 Nation Ave
- 117 Vine St
- 124 Wynona Dr
- 922 E Somers St
- 125 E Decatur St
- 233 N Barron St
- 99 Katherine Dr
- 219 E High St
- The Heath House Plan at Meadowbrook Estates
- The Aspen House Plan at Meadowbrook Estates
- The Reed II House Plan at Meadowbrook Estates
- The Rowan House Plan at Meadowbrook Estates
- The Linden House Plan at Meadowbrook Estates
- The Sequoia House Plan at Meadowbrook Estates
- 414 N Maple St
- 0-00 Washington Jackson Rd
- 832 Cypress Ln
- 824 Cypress Ln
- 825 Oakland Dr
- 829 Oakland Dr
- 821 Oakland Dr
- 836 Cypress Ln
- 820 Cypress Ln
- 825 Cypress Ln
- 829 Cypress Ln
- 833 Oakland Dr Unit 835
- 821 Cypress Ln
- 817 Oakland Dr
- 833 Cypress Ln
- 840 Cypress Ln
- 817 Cypress Ln
- 816 Cypress Ln
- 837 Oakland Dr Unit 839
- 837 Cypress Ln
- 824 Redwood Dr
- 824 Oakland Dr Unit 826