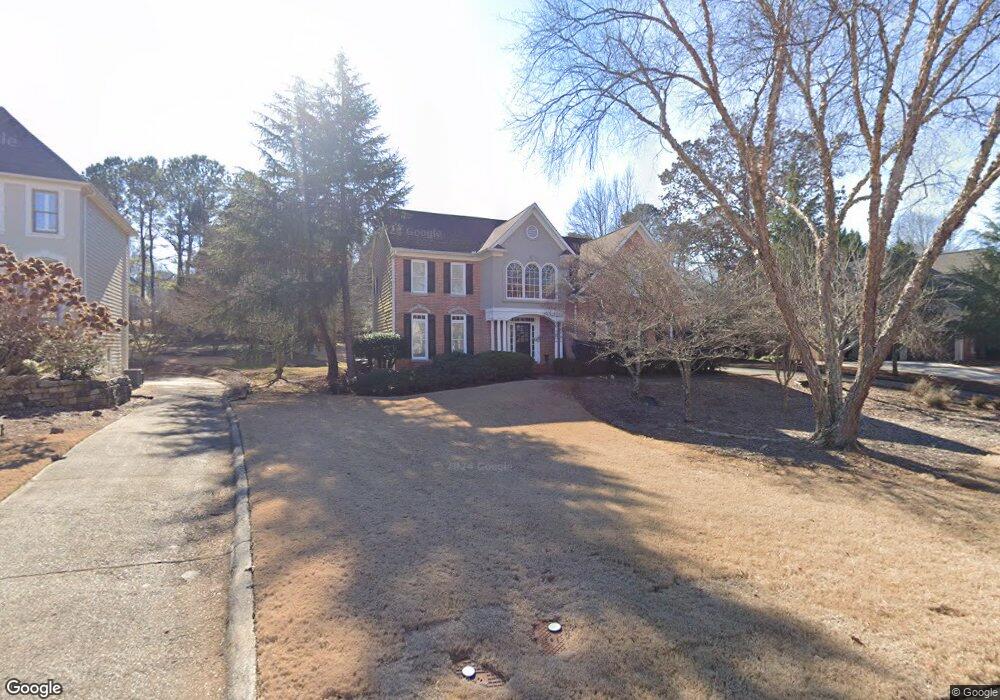
828 Lakeglen Dr Unit IIA Suwanee, GA 30024
Estimated Value: $658,142 - $797,000
4
Beds
3
Baths
2,586
Sq Ft
$287/Sq Ft
Est. Value
About This Home
This home is located at 828 Lakeglen Dr Unit IIA, Suwanee, GA 30024 and is currently estimated at $743,036, approximately $287 per square foot. 828 Lakeglen Dr Unit IIA is a home located in Forsyth County with nearby schools including Settles Bridge Elementary School, Riverwatch Middle School, and Lambert High School.
Ownership History
Date
Name
Owned For
Owner Type
Purchase Details
Closed on
Oct 14, 2002
Sold by
Gates David
Bought by
Gates David and Gates Susan
Current Estimated Value
Home Financials for this Owner
Home Financials are based on the most recent Mortgage that was taken out on this home.
Original Mortgage
$261,000
Outstanding Balance
$108,221
Interest Rate
6.01%
Mortgage Type
New Conventional
Estimated Equity
$634,815
Purchase Details
Closed on
Jan 15, 1999
Sold by
Morris Jeffrey B and Morris Kelly B
Bought by
Skilling Robert N and Skilling Kay D
Home Financials for this Owner
Home Financials are based on the most recent Mortgage that was taken out on this home.
Original Mortgage
$204,250
Interest Rate
6.71%
Mortgage Type
New Conventional
Purchase Details
Closed on
Jun 16, 1995
Sold by
John Wieland Homes
Bought by
Morris Jeffrey
Create a Home Valuation Report for This Property
The Home Valuation Report is an in-depth analysis detailing your home's value as well as a comparison with similar homes in the area
Home Values in the Area
Average Home Value in this Area
Purchase History
| Date | Buyer | Sale Price | Title Company |
|---|---|---|---|
| Gates David | -- | -- | |
| Gates David | $275,000 | -- | |
| Skilling Robert N | $215,000 | -- | |
| Morris Jeffrey | $199,700 | -- |
Source: Public Records
Mortgage History
| Date | Status | Borrower | Loan Amount |
|---|---|---|---|
| Open | Gates David | $261,000 | |
| Previous Owner | Skilling Robert N | $204,250 |
Source: Public Records
Tax History Compared to Growth
Tax History
| Year | Tax Paid | Tax Assessment Tax Assessment Total Assessment is a certain percentage of the fair market value that is determined by local assessors to be the total taxable value of land and additions on the property. | Land | Improvement |
|---|---|---|---|---|
| 2025 | $4,892 | $251,400 | $72,000 | $179,400 |
| 2024 | $4,892 | $244,632 | $70,000 | $174,632 |
| 2023 | $4,226 | $225,576 | $60,000 | $165,576 |
| 2022 | $4,228 | $153,092 | $40,000 | $113,092 |
| 2021 | $3,803 | $153,092 | $40,000 | $113,092 |
| 2020 | $3,675 | $146,916 | $40,000 | $106,916 |
| 2019 | $3,665 | $146,104 | $40,000 | $106,104 |
| 2018 | $3,569 | $140,768 | $40,000 | $100,768 |
| 2017 | $3,350 | $129,720 | $30,000 | $99,720 |
| 2016 | $3,214 | $123,280 | $30,000 | $93,280 |
| 2015 | $3,220 | $123,280 | $30,000 | $93,280 |
| 2014 | $2,896 | $115,268 | $0 | $0 |
Source: Public Records
Map
Nearby Homes
- 812 Lakemere Crest
- 109 Highgrove Dr
- 1140 Deborah Ln
- 338 Grand Ave
- 1610 Apollo Dr
- 1445 Thunder Gulch Pass
- 104 Riverview Dr
- 1140 Easy St
- 1112 Bartlett Trace
- 1104 Bartlett Trace
- 1101 Bartlett Trace
- 6785 Sterling Dr
- 195 Woodcliff Ct
- 915 Taylor Pkwy
- 1565 Bramble Bush Way
- 1750 Cone Flower Way
- 6625 Chambrel Way
- 1580 Bramble Bush Way
- 6640 Bridlewood Way
- 310 Burgess Mill Trail
- 832 Lakeglen Dr
- 822 Lakeglen Dr Unit 2A
- 822 Lakeglen Dr Unit 342
- 814 Lakeglen Dr
- 836 Lakeglen Dr
- 512 Settles Rd Unit IC
- 829 Lakeglen Dr
- 810 Lakeglen Dr
- 833 Lakeglen Dr
- 458 Grand Ave Unit 1C
- 508 Settles Rd
- 825 Lakeglen Dr
- 840 Lakeglen Dr
- 821 Lakeglen Dr
- 837 Lakeglen Dr
- 516 Settles Rd
- 504 Settles Rd
- 806 Lakeglen Dr
- 841 Lakeglen Dr
- 520 Settles Rd