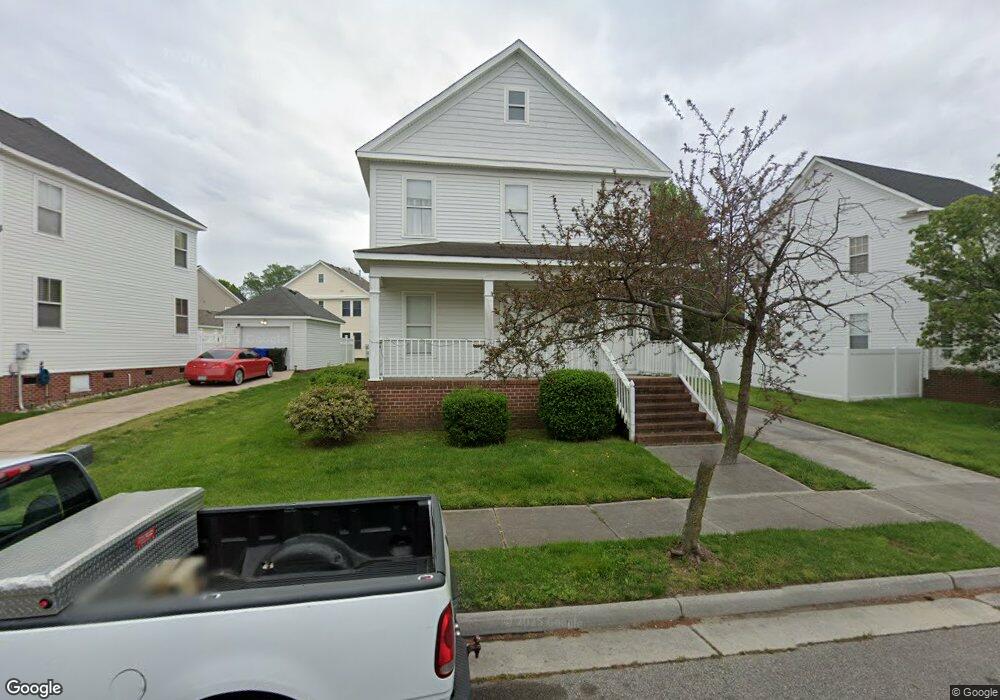
828 Maltby Crescent Norfolk, VA 23504
Brambleton NeighborhoodEstimated Value: $286,000 - $345,194
4
Beds
3
Baths
1,722
Sq Ft
$182/Sq Ft
Est. Value
About This Home
This home is located at 828 Maltby Crescent, Norfolk, VA 23504 and is currently estimated at $313,549, approximately $182 per square foot. 828 Maltby Crescent is a home located in Norfolk City with nearby schools including Chesterfield Academy Elementary School, B.T. Washington High School, and First Baptist Ready Academy Christian School.
Ownership History
Date
Name
Owned For
Owner Type
Purchase Details
Closed on
Oct 8, 2024
Sold by
Midatlantic Investor And Developer Llc
Bought by
Hernandez-Sanchez Ilvin
Current Estimated Value
Home Financials for this Owner
Home Financials are based on the most recent Mortgage that was taken out on this home.
Original Mortgage
$346,288
Outstanding Balance
$342,648
Interest Rate
6.35%
Mortgage Type
VA
Estimated Equity
-$29,099
Purchase Details
Closed on
Feb 1, 2019
Sold by
Ashraff Roshan
Bought by
Temple Doyle
Purchase Details
Closed on
Feb 26, 2018
Sold by
The Secretary Of Housing And Urban Devel
Bought by
Ashraff Roshan
Purchase Details
Closed on
Jun 27, 2017
Sold by
Us Bank National Association
Bought by
The Secretary Of Housing And Urbna Devel
Purchase Details
Closed on
Jan 4, 2017
Sold by
Trustee Services Of Virginia Llc Substit and Speller Roy C
Bought by
Us Bank National Association
Create a Home Valuation Report for This Property
The Home Valuation Report is an in-depth analysis detailing your home's value as well as a comparison with similar homes in the area
Home Values in the Area
Average Home Value in this Area
Purchase History
| Date | Buyer | Sale Price | Title Company |
|---|---|---|---|
| Hernandez-Sanchez Ilvin | $339,000 | Fortis Title | |
| Temple Doyle | $222,285 | Attorney | |
| Ashraff Roshan | $130,000 | Attorney | |
| The Secretary Of Housing And Urbna Devel | $121,472 | Attorney | |
| Us Bank National Association | $121,472 | None Available |
Source: Public Records
Mortgage History
| Date | Status | Borrower | Loan Amount |
|---|---|---|---|
| Open | Hernandez-Sanchez Ilvin | $346,288 |
Source: Public Records
Tax History
| Year | Tax Paid | Tax Assessment Tax Assessment Total Assessment is a certain percentage of the fair market value that is determined by local assessors to be the total taxable value of land and additions on the property. | Land | Improvement |
|---|---|---|---|---|
| 2025 | $4,170 | $333,600 | $84,000 | $249,600 |
| 2024 | $3,725 | $298,000 | $84,000 | $214,000 |
| 2023 | $3,608 | $288,600 | $84,000 | $204,600 |
| 2022 | $3,266 | $261,300 | $62,100 | $199,200 |
| 2021 | $2,944 | $235,500 | $54,000 | $181,500 |
| 2020 | $2,640 | $211,200 | $45,000 | $166,200 |
| 2019 | $2,576 | $206,100 | $45,000 | $161,100 |
| 2018 | $2,566 | $205,300 | $45,000 | $160,300 |
| 2017 | $2,269 | $197,300 | $45,000 | $152,300 |
| 2016 | $2,232 | $201,400 | $45,000 | $156,400 |
| 2015 | $2,293 | $201,400 | $45,000 | $156,400 |
| 2014 | $2,293 | $201,400 | $45,000 | $156,400 |
Source: Public Records
Map
Nearby Homes
- 969 Marshall Ave
- 1019 Tunstall Ave
- 1232 Maltby Ave
- 1419 Goff St
- 2428 Myrtle Ave
- 1406 Goff St
- 1014 Goff St
- 1106 Wide St
- 921 Oaklawn Ave
- 1347 Marshall Ave
- 1350 Marshall Ave
- 2312 Kimball Terrace
- 1002 Dunbar St
- 1521 Cary Ave
- 2608 Corprew Ave
- 1345 Lead St
- 2325 Cary Ave
- 706 Forbes St
- 1417 Lead St
- 1416 Bolton St
- 832 Maltby Crescent
- 825 Reservoir Crescent
- 821 Reservoir Crescent
- 836 Maltby Crescent
- 820 Maltby Crescent
- 837 Reservoir Crescent
- 840 Maltby Crescent
- 839 Maltby Crescent
- 835 Maltby Crescent
- 816 Maltby Crescent
- 817 Reservoir Crescent
- 831 Maltby Crescent
- 843 Maltby Crescent
- 1305 Corprew Ave
- 827 Maltby Crescent
- 841 Reservoir Crescent
- 1237 Corprew Ave
- 812 Maltby Crescent
- 813 Reservoir Crescent
- 823 Maltby Crescent
Your Personal Tour Guide
Ask me questions while you tour the home.