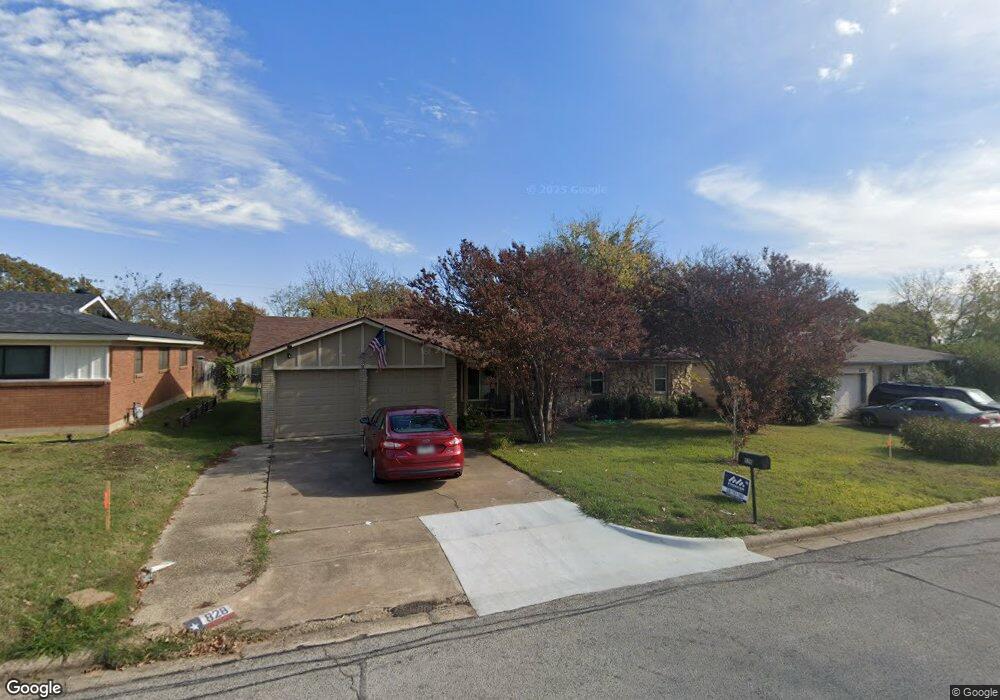
828 Mccurry Ave Bedford, TX 76022
Estimated Value: $312,000 - $348,000
4
Beds
2
Baths
1,341
Sq Ft
$244/Sq Ft
Est. Value
About This Home
This home is located at 828 Mccurry Ave, Bedford, TX 76022 and is currently estimated at $326,655, approximately $243 per square foot. 828 Mccurry Ave is a home located in Tarrant County with nearby schools including Bell Manor Elementary School, Central J High School, and Trinity High School.
Ownership History
Date
Name
Owned For
Owner Type
Purchase Details
Closed on
Jun 18, 2018
Sold by
Home Buyers Unlimited Llc
Bought by
Strell Constance S
Current Estimated Value
Home Financials for this Owner
Home Financials are based on the most recent Mortgage that was taken out on this home.
Original Mortgage
$216,015
Outstanding Balance
$186,817
Interest Rate
4.5%
Mortgage Type
FHA
Estimated Equity
$139,838
Purchase Details
Closed on
Jan 10, 2018
Sold by
Turner Stacy D and Blanchard Neal
Bought by
Home Buyers Unlimited Llc
Home Financials for this Owner
Home Financials are based on the most recent Mortgage that was taken out on this home.
Original Mortgage
$115,000
Interest Rate
3.9%
Mortgage Type
Purchase Money Mortgage
Purchase Details
Closed on
May 9, 2002
Sold by
Turner Thomas G
Bought by
Turner Stacy D
Create a Home Valuation Report for This Property
The Home Valuation Report is an in-depth analysis detailing your home's value as well as a comparison with similar homes in the area
Home Values in the Area
Average Home Value in this Area
Purchase History
| Date | Buyer | Sale Price | Title Company |
|---|---|---|---|
| Strell Constance S | -- | Texas Secure Title Co | |
| Home Buyers Unlimited Llc | -- | Old Republic Title | |
| Turner Stacy D | -- | -- |
Source: Public Records
Mortgage History
| Date | Status | Borrower | Loan Amount |
|---|---|---|---|
| Open | Strell Constance S | $216,015 | |
| Previous Owner | Home Buyers Unlimited Llc | $115,000 |
Source: Public Records
Tax History Compared to Growth
Tax History
| Year | Tax Paid | Tax Assessment Tax Assessment Total Assessment is a certain percentage of the fair market value that is determined by local assessors to be the total taxable value of land and additions on the property. | Land | Improvement |
|---|---|---|---|---|
| 2025 | $5,994 | $307,868 | $65,000 | $242,868 |
| 2024 | $5,994 | $307,868 | $65,000 | $242,868 |
| 2023 | $5,508 | $287,186 | $45,000 | $242,186 |
| 2022 | $5,430 | $248,593 | $45,000 | $203,593 |
| 2021 | $5,386 | $228,646 | $45,000 | $183,646 |
| 2020 | $4,898 | $206,027 | $45,000 | $161,027 |
| 2019 | $5,034 | $207,223 | $45,000 | $162,223 |
| 2018 | $2,619 | $123,517 | $25,000 | $98,517 |
| 2017 | $2,716 | $130,918 | $25,000 | $105,918 |
| 2016 | $2,469 | $124,442 | $25,000 | $99,442 |
| 2015 | $2,055 | $92,800 | $18,000 | $74,800 |
| 2014 | $2,055 | $92,800 | $18,000 | $74,800 |
Source: Public Records
Map
Nearby Homes
- 828 Gregory Ave
- 808 Gregory Ave
- 2101 Gettysburg Place
- 800 Prestwick St
- 2024 Charleston Dr
- 804 Natchez Ave
- 1049 Stableway Ln
- 952 Charleston Dr
- 2420 Dalewood Ln
- 1216 Princeton Place
- 2620 Britany Cir
- 1116 Highpoint Rd
- 933 Charleston Ct
- 1213 Greendale Dr
- 2428 Chestnut Way
- 2201 Greendale Ct
- 1613 Trinity Ct
- 2025 Schumac Ln
- 1604 Richmond Dr
- 2421 Creek Villas Dr
- 832 Mccurry Ave
- 824 Mccurry Ave
- 829 Gregory Ave
- 829 Gregory Ave
- 900 Mccurry Ave
- 820 Mccurry Ave
- 825 Gregory Ave
- 833 Gregory Ave
- 829 Mccurry Ave
- 833 Mccurry Ave
- 821 Gregory Ave
- 901 Gregory Ave
- 825 Mccurry Ave
- 816 Mccurry Ave
- 904 Mccurry Ave
- 901 Mccurry Ave
- 821 Mccurry Ave
- 817 Gregory Ave
- 905 Gregory Ave
- 905 Mccurry Ave