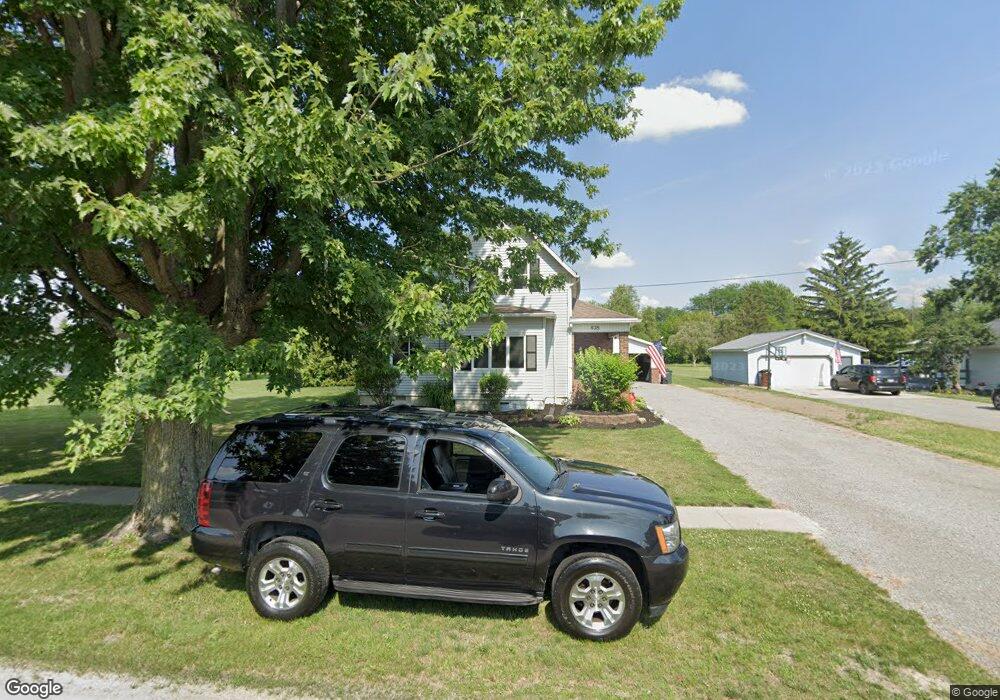
828 Moening St Delphos, OH 45833
Estimated Value: $166,000 - $190,000
3
Beds
2
Baths
1,347
Sq Ft
$133/Sq Ft
Est. Value
About This Home
This home is located at 828 Moening St, Delphos, OH 45833 and is currently estimated at $178,941, approximately $132 per square foot. 828 Moening St is a home located in Allen County with nearby schools including Delphos St. John's High School and Delphos St. John's Elementary School.
Ownership History
Date
Name
Owned For
Owner Type
Purchase Details
Closed on
Dec 4, 2020
Sold by
Rode Justin B
Bought by
Streets Kevin G
Current Estimated Value
Home Financials for this Owner
Home Financials are based on the most recent Mortgage that was taken out on this home.
Original Mortgage
$117,000
Outstanding Balance
$102,437
Interest Rate
2.8%
Mortgage Type
New Conventional
Estimated Equity
$76,504
Purchase Details
Closed on
May 23, 2018
Sold by
Graham Ii Michael T and Graham Rachel I
Bought by
Rode Justin B
Home Financials for this Owner
Home Financials are based on the most recent Mortgage that was taken out on this home.
Original Mortgage
$115,847
Interest Rate
4.4%
Mortgage Type
New Conventional
Purchase Details
Closed on
Dec 31, 2002
Sold by
Schleeter Steven B
Bought by
Graham Ii Michael T Rachel I
Home Financials for this Owner
Home Financials are based on the most recent Mortgage that was taken out on this home.
Original Mortgage
$82,650
Interest Rate
6.01%
Mortgage Type
New Conventional
Purchase Details
Closed on
Feb 9, 1994
Sold by
Suever Michael D
Bought by
Schleeter Steven B and Schleeter Pamela J
Purchase Details
Closed on
Mar 1, 1979
Bought by
Suever Michael D
Create a Home Valuation Report for This Property
The Home Valuation Report is an in-depth analysis detailing your home's value as well as a comparison with similar homes in the area
Home Values in the Area
Average Home Value in this Area
Purchase History
We collect this data history from publicly available records. To have your information removed, we recommend requesting removal directly through your county’s website.
| Date | Buyer | Sale Price | Title Company |
|---|---|---|---|
| Streets Kevin G | $130,000 | None Available | |
| Rode Justin B | $114,700 | None Available | |
| Graham Ii Michael T Rachel I | $87,000 | -- | |
| Schleeter Steven B | $64,500 | -- | |
| Suever Michael D | $22,000 | -- |
Source: Public Records
Mortgage History
We collect this data history from publicly available records. To have your information removed, we recommend requesting removal directly through your county’s website.
| Date | Status | Borrower | Loan Amount |
|---|---|---|---|
| Open | Streets Kevin G | $117,000 | |
| Previous Owner | Rode Justin B | $115,847 | |
| Previous Owner | Graham Ii Michael T Rachel I | $82,650 |
Source: Public Records
Tax History
| Year | Tax Paid | Tax Assessment Tax Assessment Total Assessment is a certain percentage of the fair market value that is determined by local assessors to be the total taxable value of land and additions on the property. | Land | Improvement |
|---|---|---|---|---|
| 2024 | $1,853 | $58,560 | $10,780 | $47,780 |
| 2023 | $1,459 | $43,720 | $8,050 | $35,670 |
| 2022 | $1,479 | $43,260 | $8,050 | $35,210 |
| 2021 | $1,488 | $43,260 | $8,050 | $35,210 |
| 2020 | $952 | $29,650 | $7,700 | $21,950 |
| 2019 | $952 | $29,650 | $7,700 | $21,950 |
| 2018 | $966 | $29,650 | $7,700 | $21,950 |
| 2017 | $903 | $27,650 | $7,700 | $19,950 |
| 2016 | $916 | $27,650 | $7,700 | $19,950 |
| 2015 | $904 | $27,650 | $7,700 | $19,950 |
| 2014 | $868 | $26,220 | $7,390 | $18,830 |
| 2013 | $872 | $26,220 | $7,390 | $18,830 |
Source: Public Records
Map
Nearby Homes
- 628 N Pierce St
- 534 E 5th St
- 610 N Washington St
- 702 N Main St
- 1114 Rozelle Ave
- 1204 N Main St
- 201 E 5th St
- 821 E 3rd St
- 404 E 3rd St
- 904 E 2nd St
- 1000 Colettas Way
- 221 S Main St
- 424 S Canal St
- 483 S Franklin St
- 7110 Elida Rd
- 21198 Road V
- 19200 State Route 190
- 6225 Redd Rd
- 8448 Elida Rd
- 6875 Ridge Rd
- 908 Moening St
- 908 N Moening St
- 828 N Moening St
- 909 N Moening St
- 909 Moening St
- 903 Moening St
- 927 N Moening St
- 829 N Moening St
- 829 Moening St
- 940 Moening St
- 820 Moening St
- 927 Moening St
- 827 Moening St
- 920 N Moening St
- 920 Moening St
- 814 Moening St
- 506 E 9th St
- 935 Moening St
- 813 Moening St
- 810 Moening St
Your Personal Tour Guide
Ask me questions while you tour the home.