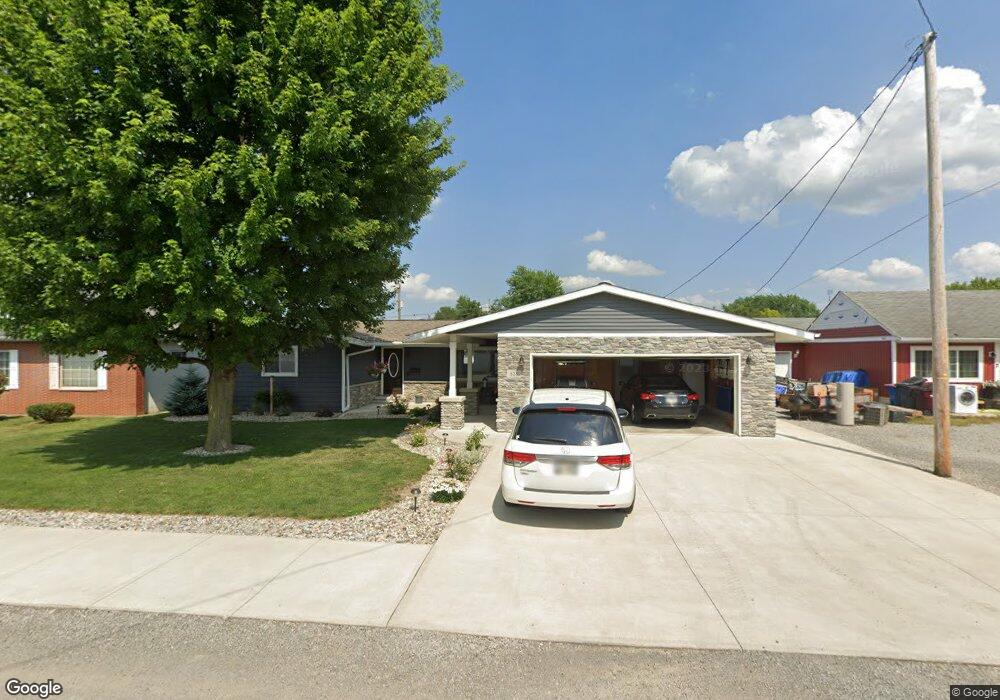
828 N Clay St Delphos, OH 45833
Estimated Value: $155,000 - $179,000
3
Beds
1
Bath
1,272
Sq Ft
$133/Sq Ft
Est. Value
About This Home
This home is located at 828 N Clay St, Delphos, OH 45833 and is currently estimated at $169,084, approximately $132 per square foot. 828 N Clay St is a home located in Van Wert County with nearby schools including Delphos St. John's High School and Delphos St. John's Elementary School.
Ownership History
Date
Name
Owned For
Owner Type
Purchase Details
Closed on
Mar 28, 2012
Sold by
Suever Allison
Bought by
Schuerman Gregory T and Schuerman Carol A
Current Estimated Value
Home Financials for this Owner
Home Financials are based on the most recent Mortgage that was taken out on this home.
Original Mortgage
$72,000
Outstanding Balance
$28,068
Interest Rate
3.9%
Mortgage Type
New Conventional
Estimated Equity
$141,016
Purchase Details
Closed on
Feb 28, 2006
Sold by
Clark Lisa
Bought by
Suever Allison
Home Financials for this Owner
Home Financials are based on the most recent Mortgage that was taken out on this home.
Original Mortgage
$69,350
Interest Rate
6.2%
Mortgage Type
New Conventional
Purchase Details
Closed on
Apr 2, 2004
Bought by
Schuerman Gregory T and Schuerman Carol
Purchase Details
Closed on
Mar 1, 2003
Bought by
Suever Allison
Purchase Details
Closed on
Feb 22, 2002
Bought by
Clark Paul and Clark Lisa
Create a Home Valuation Report for This Property
The Home Valuation Report is an in-depth analysis detailing your home's value as well as a comparison with similar homes in the area
Home Values in the Area
Average Home Value in this Area
Purchase History
| Date | Buyer | Sale Price | Title Company |
|---|---|---|---|
| Schuerman Gregory T | $90,000 | Attorney | |
| Suever Allison | $73,000 | None Available | |
| Schuerman Gregory T | $90,000 | -- | |
| Schuerman Gregory T | $90,000 | -- | |
| Suever Allison | $73,000 | -- | |
| Suever Allison | $73,000 | -- | |
| Clark Paul | $67,000 | -- | |
| Clark Paul | $67,000 | -- |
Source: Public Records
Mortgage History
| Date | Status | Borrower | Loan Amount |
|---|---|---|---|
| Open | Schuerman Gregory T | $72,000 | |
| Closed | Suever Allison | $69,350 |
Source: Public Records
Tax History
| Year | Tax Paid | Tax Assessment Tax Assessment Total Assessment is a certain percentage of the fair market value that is determined by local assessors to be the total taxable value of land and additions on the property. | Land | Improvement |
|---|---|---|---|---|
| 2025 | $1,386 | $48,940 | $3,750 | $45,190 |
| 2024 | $1,386 | $48,940 | $3,750 | $45,190 |
| 2023 | $1,382 | $48,940 | $3,750 | $45,190 |
| 2022 | $916 | $29,580 | $2,960 | $26,620 |
| 2021 | $918 | $29,580 | $2,960 | $26,620 |
| 2020 | $945 | $29,580 | $2,960 | $26,620 |
| 2019 | $763 | $26,580 | $2,960 | $23,620 |
| 2018 | $768 | $26,580 | $2,960 | $23,620 |
| 2017 | $707 | $26,580 | $2,960 | $23,620 |
| 2016 | $638 | $22,460 | $2,960 | $19,500 |
| 2015 | $638 | $22,460 | $2,960 | $19,500 |
| 2014 | $670 | $22,460 | $2,960 | $19,500 |
| 2013 | $714 | $22,460 | $2,960 | $19,500 |
Source: Public Records
Map
Nearby Homes
- 629 N Main St
- 702 N Main St
- 537 / 539 Toomey
- 10429 Ohio 66
- 610 N Washington St
- 409 N Bredeick St
- 201 E 5th St
- 709 W 4th St
- 628 N Pierce St
- 221 S Main St
- 821 E 3rd St
- 424 S Canal St
- 483 S Franklin St
- 827 S Washington St
- 1000 Colettas Way
- 7110 Elida Rd
- 6800 N Defiance Trail
- 8448 Elida Rd
- 608 N Adams St
- 112 W Railroad St
- 908 N Clay St
- 822 N Clay St
- 816 N Clay St
- 911 N Jefferson St
- 902 Metbliss Ave
- 824 Metbliss Ave
- 929 N Jefferson St
- 901 N Jefferson St
- 901 & 903 Jefferson St N
- 810 N Clay St
- 822 Metbliss Ave
- 908 Metbliss Ave
- 933 N Jefferson St
- 816 Metbliss Ave
- 912 Metbliss Ave
- 807 N Jefferson St
- 935 N Jefferson St
- 334 W 8th St
Your Personal Tour Guide
Ask me questions while you tour the home.