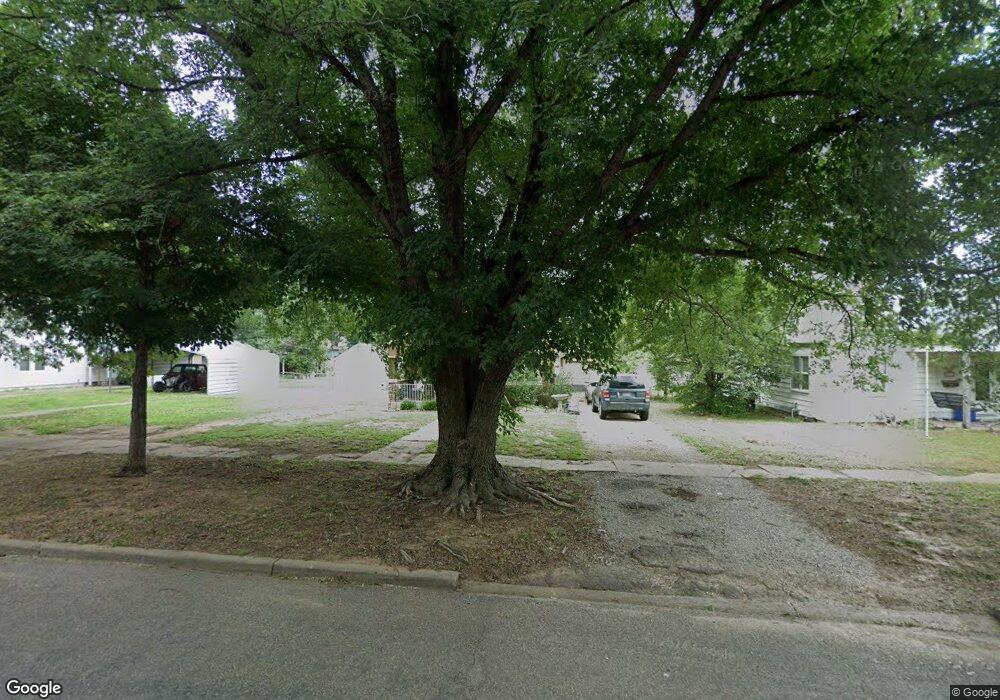
828 N Osage St Ponca City, OK 74601
Estimated Value: $51,000 - $73,000
2
Beds
1
Bath
1,034
Sq Ft
$58/Sq Ft
Est. Value
About This Home
This home is located at 828 N Osage St, Ponca City, OK 74601 and is currently estimated at $60,153, approximately $58 per square foot. 828 N Osage St is a home located in Kay County with nearby schools including Liberty Elementary School, Ponca City West Middle School, and Ponca City East Middle School.
Ownership History
Date
Name
Owned For
Owner Type
Purchase Details
Closed on
Apr 25, 2005
Sold by
Gravel Marc L and Gravel Judy
Bought by
Higgins Rebecca L
Current Estimated Value
Home Financials for this Owner
Home Financials are based on the most recent Mortgage that was taken out on this home.
Original Mortgage
$34,979
Outstanding Balance
$18,495
Interest Rate
6.06%
Mortgage Type
FHA
Estimated Equity
$41,658
Purchase Details
Closed on
Sep 19, 2001
Sold by
Cheryl Dennis and Cheryl Knapp
Bought by
Marc Gravel and Karen Tapp
Purchase Details
Closed on
Sep 18, 2001
Sold by
Gayle Bergen
Bought by
Marc Gravel and Karen Tapp
Purchase Details
Closed on
Nov 6, 2000
Sold by
Hazel Herbig
Bought by
Dennis Knapp and Dennis Bergen G
Purchase Details
Closed on
May 22, 1997
Sold by
Donald M Sawyer
Bought by
Hazel B Herbig
Purchase Details
Closed on
Sep 5, 1989
Sold by
General Elect Mtg Ins Cor
Bought by
Donald M Sawyer
Create a Home Valuation Report for This Property
The Home Valuation Report is an in-depth analysis detailing your home's value as well as a comparison with similar homes in the area
Home Values in the Area
Average Home Value in this Area
Purchase History
| Date | Buyer | Sale Price | Title Company |
|---|---|---|---|
| Higgins Rebecca L | $34,900 | -- | |
| Marc Gravel | $25,500 | -- | |
| Marc Gravel | -- | -- | |
| Dennis Knapp | -- | -- | |
| Hazel B Herbig | $24,500 | -- | |
| Donald M Sawyer | $13,500 | -- |
Source: Public Records
Mortgage History
| Date | Status | Borrower | Loan Amount |
|---|---|---|---|
| Open | Higgins Rebecca L | $34,979 |
Source: Public Records
Tax History Compared to Growth
Tax History
| Year | Tax Paid | Tax Assessment Tax Assessment Total Assessment is a certain percentage of the fair market value that is determined by local assessors to be the total taxable value of land and additions on the property. | Land | Improvement |
|---|---|---|---|---|
| 2024 | $424 | $4,483 | $404 | $4,079 |
| 2023 | $424 | $4,270 | $404 | $3,866 |
| 2022 | $387 | $4,066 | $404 | $3,662 |
| 2021 | $389 | $4,066 | $404 | $3,662 |
| 2020 | $383 | $4,043 | $404 | $3,639 |
| 2019 | $368 | $3,851 | $404 | $3,447 |
| 2018 | $366 | $3,779 | $404 | $3,375 |
| 2017 | $370 | $3,779 | $404 | $3,375 |
| 2016 | $374 | $3,779 | $404 | $3,375 |
| 2015 | $361 | $3,632 | $404 | $3,228 |
| 2014 | $351 | $3,600 | $404 | $3,196 |
Source: Public Records
Map
Nearby Homes
- 745 N Lake St
- 802 N Ash St
- 941 N Ash St
- 505 N Pine St
- 1021 Riviera Dr
- 1016 N Oak St
- 602 N Palm St
- 1008 N 1st St
- 1035 N Sunset St
- 920 N 4th St
- 400 Hampton Dr
- 417 N 3rd St
- 1504 W Broadway Ave
- 1708 Potomac Dr
- 4025 S Union St
- 304 E Detroit Ave
- 409 N 5th St
- 113 E Fresno Ave
- 401 E Emporia Ave
- 412 N 7th St