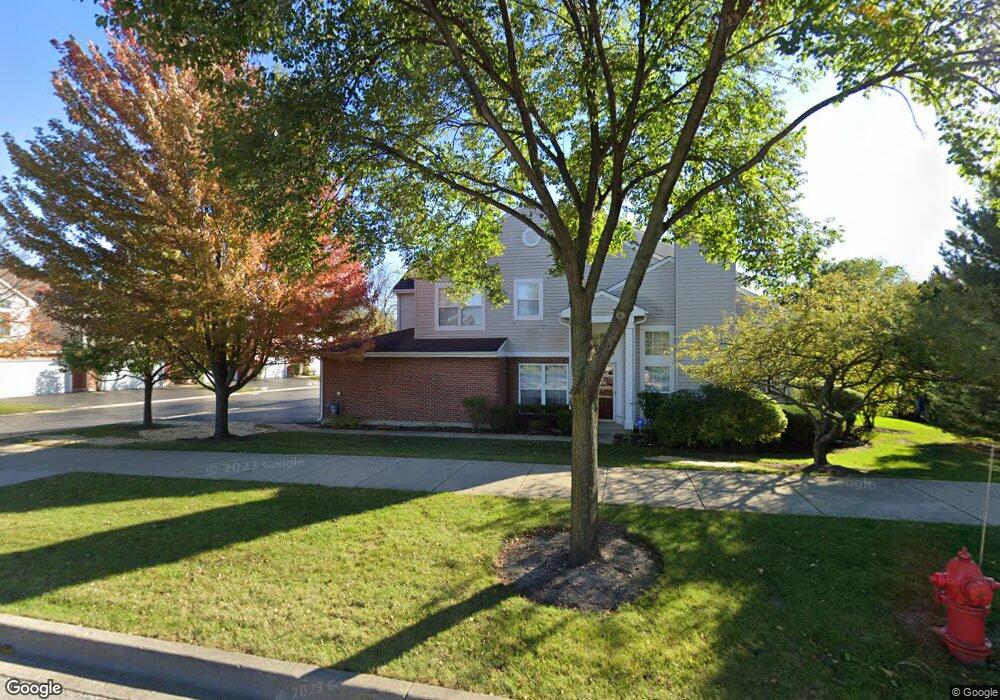
828 Old Checker Rd Unit A5 Buffalo Grove, IL 60089
Estimated Value: $331,299 - $387,000
--
Bed
2
Baths
1,268
Sq Ft
$281/Sq Ft
Est. Value
About This Home
This home is located at 828 Old Checker Rd Unit A5, Buffalo Grove, IL 60089 and is currently estimated at $355,825, approximately $280 per square foot. 828 Old Checker Rd Unit A5 is a home located in Lake County with nearby schools including Ivy Hall Elementary School, Twin Groves Middle School, and Adlai E Stevenson High School.
Ownership History
Date
Name
Owned For
Owner Type
Purchase Details
Closed on
Nov 16, 2015
Sold by
Schutte Susan
Bought by
Schutte Susan and Susan V Schutte Trust
Current Estimated Value
Purchase Details
Closed on
Jun 25, 2012
Sold by
Flood Veronica
Bought by
Schutte` Susan
Purchase Details
Closed on
Aug 2, 1999
Sold by
Wehrheim Richard D and Wehrheim Cari A
Bought by
Schutte Susan and Flood Veronica
Home Financials for this Owner
Home Financials are based on the most recent Mortgage that was taken out on this home.
Original Mortgage
$92,000
Interest Rate
7.77%
Mortgage Type
Purchase Money Mortgage
Purchase Details
Closed on
May 23, 1995
Sold by
Oak Brook Bank
Bought by
Wehrheim Richard D and Wehrheim Cari A
Home Financials for this Owner
Home Financials are based on the most recent Mortgage that was taken out on this home.
Original Mortgage
$153,500
Interest Rate
8.27%
Mortgage Type
Purchase Money Mortgage
Create a Home Valuation Report for This Property
The Home Valuation Report is an in-depth analysis detailing your home's value as well as a comparison with similar homes in the area
Home Values in the Area
Average Home Value in this Area
Purchase History
| Date | Buyer | Sale Price | Title Company |
|---|---|---|---|
| Schutte Susan | -- | Attorney | |
| Schutte` Susan | -- | None Available | |
| Schutte Susan | $186,500 | -- | |
| Wehrheim Richard D | $171,000 | 1St American Title |
Source: Public Records
Mortgage History
| Date | Status | Borrower | Loan Amount |
|---|---|---|---|
| Previous Owner | Schutte Susan | $92,000 | |
| Previous Owner | Wehrheim Richard D | $153,500 |
Source: Public Records
Tax History Compared to Growth
Tax History
| Year | Tax Paid | Tax Assessment Tax Assessment Total Assessment is a certain percentage of the fair market value that is determined by local assessors to be the total taxable value of land and additions on the property. | Land | Improvement |
|---|---|---|---|---|
| 2024 | $7,353 | $92,922 | $34,396 | $58,526 |
| 2023 | $7,132 | $87,679 | $32,455 | $55,224 |
| 2022 | $7,132 | $79,398 | $29,390 | $50,008 |
| 2021 | $5,683 | $78,542 | $29,073 | $49,469 |
| 2020 | $5,688 | $78,810 | $29,172 | $49,638 |
| 2019 | $6,610 | $78,519 | $29,064 | $49,455 |
| 2018 | $5,210 | $68,613 | $31,591 | $37,022 |
| 2017 | $5,856 | $67,012 | $30,854 | $36,158 |
| 2016 | $5,648 | $64,169 | $29,545 | $34,624 |
| 2015 | $5,479 | $60,010 | $27,630 | $32,380 |
| 2014 | $6,251 | $66,736 | $29,676 | $37,060 |
| 2012 | $6,179 | $66,869 | $29,735 | $37,134 |
Source: Public Records
Map
Nearby Homes
- 746 Old Checker Rd Unit E5
- 728 Old Checker Rd Unit C4
- 412 Chateau Dr
- 1112 Auburn Ln
- 232 Manor Dr Unit 12C
- 630 Woodhollow Ln
- 620 Twisted Oak Ln
- 610 Maple Dr
- 760 Checker Dr
- 810 Silver Rock Ln
- 25 Crestview Terrace
- 36 Crestview Terrace
- 690 Dunhill Dr
- 12 Cloverdale Ct
- 938 Hidden Lake Dr
- 496 Raupp Blvd
- 612 White Pine Rd
- 131 Autumn Ct Unit CT10602
- 1514 Sumter Dr
- 1545 Chickamauga Ln
- 826 Old Checker Rd Unit B6
- 824 Old Checker Rd Unit C4
- 822 Old Checker Rd Unit E3
- 822 Old Checker Rd Unit 11-E-3
- 818 Old Checker Rd Unit B2
- 816 Old Checker Rd Unit A1
- 832 Old Checker Rd Unit D1
- 834 Old Checker Rd Unit C2
- 766 Old Checker Rd Unit D1
- 836 Old Checker Rd Unit E3
- 772 Old Checker Rd Unit E3
- 774 Old Checker Rd Unit C4
- 776 Old Checker Rd Unit B6
- 778 Old Checker Rd Unit A5
- 814 Old Checker Rd Unit D4
- 812 Old Checker Rd Unit E3
- 842 Old Checker Rd Unit D1
- 782 Old Checker Rd Unit A1
- 808 Old Checker Rd Unit C2
- 764 Old Checker Rd Unit A5