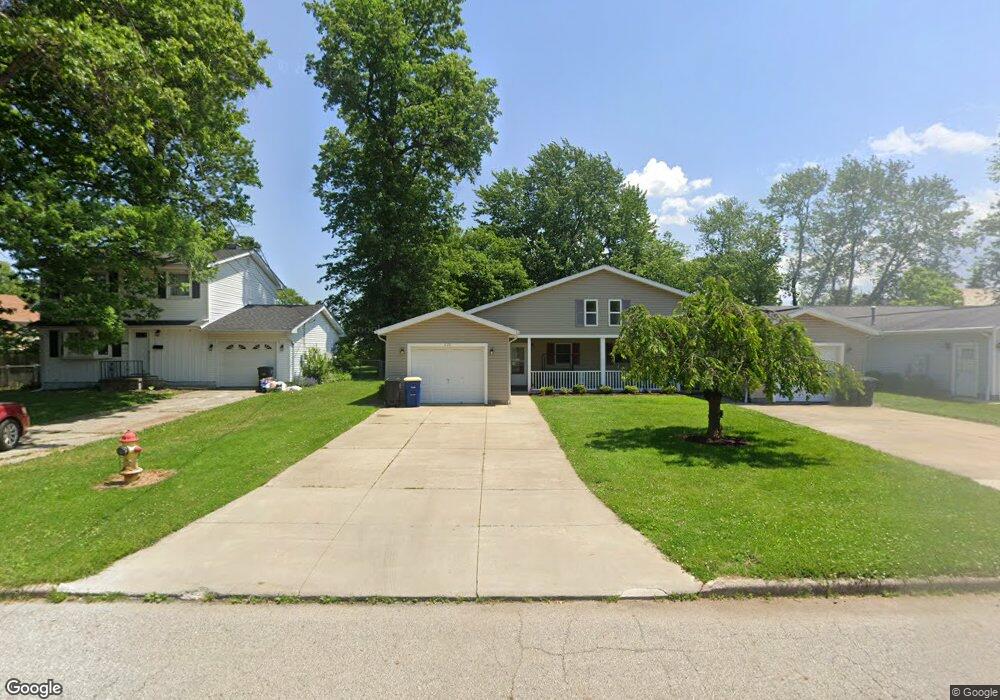
828 Pennsylvania Ave Unit 830 Ashtabula, OH 44004
Estimated Value: $179,000 - $193,717
4
Beds
4
Baths
2,464
Sq Ft
$76/Sq Ft
Est. Value
About This Home
This home is located at 828 Pennsylvania Ave Unit 830, Ashtabula, OH 44004 and is currently estimated at $186,929, approximately $75 per square foot. 828 Pennsylvania Ave Unit 830 is a home located in Ashtabula County with nearby schools including Lakeside High School and Christian Faith Academy.
Ownership History
Date
Name
Owned For
Owner Type
Purchase Details
Closed on
Nov 6, 2003
Sold by
Peterson David E and Peterson Kathleen E
Bought by
Peterson David E and Peterson Kathleen E
Current Estimated Value
Home Financials for this Owner
Home Financials are based on the most recent Mortgage that was taken out on this home.
Original Mortgage
$116,800
Interest Rate
6.02%
Mortgage Type
Unknown
Purchase Details
Closed on
Nov 5, 2003
Sold by
Duff Ronald W and Duff Mary F
Bought by
Peterson David E and Peterson Kathleen E
Home Financials for this Owner
Home Financials are based on the most recent Mortgage that was taken out on this home.
Original Mortgage
$116,800
Interest Rate
6.02%
Mortgage Type
Unknown
Purchase Details
Closed on
Oct 13, 2000
Sold by
Duff Ronald
Bought by
Peterson David E and Peterson Kathleen
Create a Home Valuation Report for This Property
The Home Valuation Report is an in-depth analysis detailing your home's value as well as a comparison with similar homes in the area
Home Values in the Area
Average Home Value in this Area
Purchase History
| Date | Buyer | Sale Price | Title Company |
|---|---|---|---|
| Peterson David E | -- | Chicago Title Agency | |
| Peterson David E | -- | Chicago Title Agency | |
| Peterson David E | $22,000 | -- |
Source: Public Records
Mortgage History
| Date | Status | Borrower | Loan Amount |
|---|---|---|---|
| Closed | Peterson David E | $116,800 |
Source: Public Records
Tax History Compared to Growth
Tax History
| Year | Tax Paid | Tax Assessment Tax Assessment Total Assessment is a certain percentage of the fair market value that is determined by local assessors to be the total taxable value of land and additions on the property. | Land | Improvement |
|---|---|---|---|---|
| 2024 | $4,076 | $46,100 | $5,920 | $40,180 |
| 2023 | $2,372 | $46,100 | $5,920 | $40,180 |
| 2022 | $2,156 | $36,720 | $4,550 | $32,170 |
| 2021 | $2,172 | $36,720 | $4,550 | $32,170 |
| 2020 | $2,205 | $36,720 | $4,550 | $32,170 |
| 2019 | $2,671 | $42,530 | $4,830 | $37,700 |
| 2018 | $2,436 | $42,530 | $4,830 | $37,700 |
| 2017 | $2,381 | $42,530 | $4,830 | $37,700 |
| 2016 | $2,392 | $39,940 | $4,550 | $35,390 |
| 2015 | $4,596 | $39,940 | $4,550 | $35,390 |
| 2014 | $2,935 | $51,870 | $4,550 | $47,320 |
| 2013 | $2,258 | $42,570 | $4,170 | $38,400 |
Source: Public Records
Map
Nearby Homes
- 834 Pennsylvania Ave Unit 836
- 820 Pennsylvania Ave
- 821 Michigan Ave
- 1726 W 8th St
- 1727 W 9th St
- 1730 W 8th St
- 1720 W 8th St
- 819 Michigan Ave
- 1731 W 9th St
- 835 Michigan Ave
- 1719 W 9th St
- 1716 W 8th St
- 1715 W 9th St
- 1712 W 8th St
- 829 Pennsylvania Ave
- 823 Pennsylvania Ave
- 1711 W 9th St
- 1803 W 9th St
- 833 Pennsylvania Ave
- 1806 W 8th St