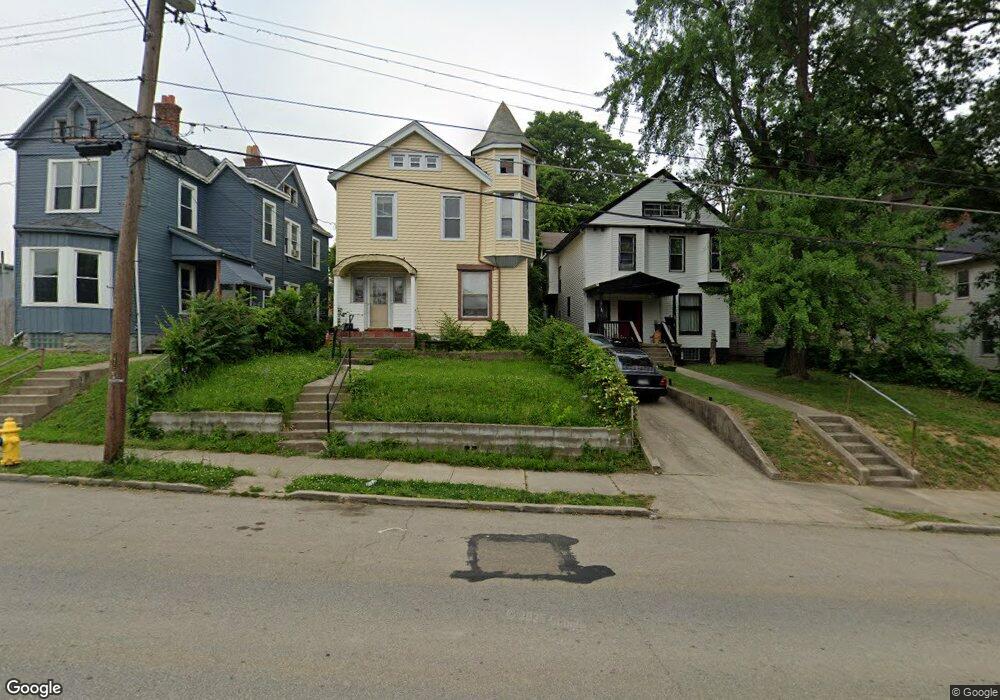
828 Rockdale Ave Cincinnati, OH 45229
Avondale NeighborhoodEstimated Value: $139,000 - $479,000
5
Beds
3
Baths
2,937
Sq Ft
$96/Sq Ft
Est. Value
About This Home
This home is located at 828 Rockdale Ave, Cincinnati, OH 45229 and is currently estimated at $283,000, approximately $96 per square foot. 828 Rockdale Ave is a home located in Hamilton County with nearby schools including South Avondale School, Clark Montessori High School, and Robert A. Taft Information Technology High School.
Ownership History
Date
Name
Owned For
Owner Type
Purchase Details
Closed on
Oct 16, 2017
Sold by
Guardian Savings Bank
Bought by
Johnson Lonnie
Current Estimated Value
Purchase Details
Closed on
Feb 8, 2007
Sold by
Franklin Credit Management Corp
Bought by
Sebastian Terrence
Home Financials for this Owner
Home Financials are based on the most recent Mortgage that was taken out on this home.
Original Mortgage
$22,750
Interest Rate
6.27%
Mortgage Type
Unknown
Purchase Details
Closed on
Nov 20, 2006
Sold by
Bond Byers Terri L and Byers Anthony G
Bought by
Franklin Credit Management Corp
Purchase Details
Closed on
Jul 27, 1999
Sold by
Bond Terri L
Bought by
Byers Anthony G and Bond Byers Terri L
Purchase Details
Closed on
May 9, 1996
Sold by
Robinson Edna
Bought by
Bond Terri L
Home Financials for this Owner
Home Financials are based on the most recent Mortgage that was taken out on this home.
Original Mortgage
$58,100
Interest Rate
7.86%
Purchase Details
Closed on
Sep 23, 1994
Sold by
Martin Hallie
Bought by
Martin Hallie and Robinson Edna
Create a Home Valuation Report for This Property
The Home Valuation Report is an in-depth analysis detailing your home's value as well as a comparison with similar homes in the area
Home Values in the Area
Average Home Value in this Area
Purchase History
| Date | Buyer | Sale Price | Title Company |
|---|---|---|---|
| Johnson Lonnie | $17,000 | None Available | |
| Sebastian Terrence | $22,800 | Attorney | |
| Franklin Credit Management Corp | $57,728 | None Available | |
| Byers Anthony G | -- | -- | |
| Bond Terri L | $59,900 | -- | |
| Martin Hallie | -- | -- |
Source: Public Records
Mortgage History
| Date | Status | Borrower | Loan Amount |
|---|---|---|---|
| Previous Owner | Sebastian Terrence | $22,750 | |
| Previous Owner | Bond Terri L | $58,100 |
Source: Public Records
Tax History Compared to Growth
Tax History
| Year | Tax Paid | Tax Assessment Tax Assessment Total Assessment is a certain percentage of the fair market value that is determined by local assessors to be the total taxable value of land and additions on the property. | Land | Improvement |
|---|---|---|---|---|
| 2024 | $2,014 | $31,679 | $4,795 | $26,884 |
| 2023 | $2,018 | $31,679 | $4,795 | $26,884 |
| 2022 | $1,347 | $18,960 | $4,795 | $14,165 |
| 2021 | $1,321 | $18,960 | $4,795 | $14,165 |
| 2020 | $1,324 | $18,960 | $4,795 | $14,165 |
| 2019 | $1,360 | $17,717 | $4,480 | $13,237 |
| 2018 | $1,352 | $17,717 | $4,480 | $13,237 |
| 2017 | $1,302 | $17,717 | $4,480 | $13,237 |
| 2016 | $1,507 | $21,214 | $4,725 | $16,489 |
| 2015 | $1,358 | $21,214 | $4,725 | $16,489 |
| 2014 | $1,368 | $21,214 | $4,725 | $16,489 |
| 2013 | $1,392 | $21,214 | $4,725 | $16,489 |
Source: Public Records
Map
Nearby Homes
- 844 Windham Ave
- 816 Windham Ave
- 855 Rockdale Ave
- 3429 Reading Rd
- 899 Lexington Ave
- 871 Hutchins Ave
- 863 Rockdale Ave
- 651 Glenwood Ave
- 3553 van Antwerp Place
- 3319 Milton Ct
- 699 Gholson Ave
- 918 Glenwood Ave
- 3636 Reading Rd
- 694 Gholson Ave
- 533 Rockdale Ave
- 925 Glenwood Ave
- 3440 Harvey Ave
- 567 Stewart Place
- 434 Northern Ave
- 3565 Harvey Ave
- 826 Rockdale Ave
- 830 Rockdale Ave
- 832 Rockdale Ave
- 834 Rockdale Ave
- 817 Hutchins Ave
- 819 Hutchins Ave
- 819 Hutchins Ave
- 836 Rockdale Ave
- 838 Rockdale Ave
- 831 Rockdale Ave
- 840 Rockdale Ave
- 833 Rockdale Ave
- 3500 Reading Rd
- 842 Rockdale Ave
- 825 Hutchins Ave
- 837 Rockdale Ave
- 839 Rockdale Ave
- 844 Rockdale Ave
- 827 Hutchins Ave
- 841 Rockdale Ave