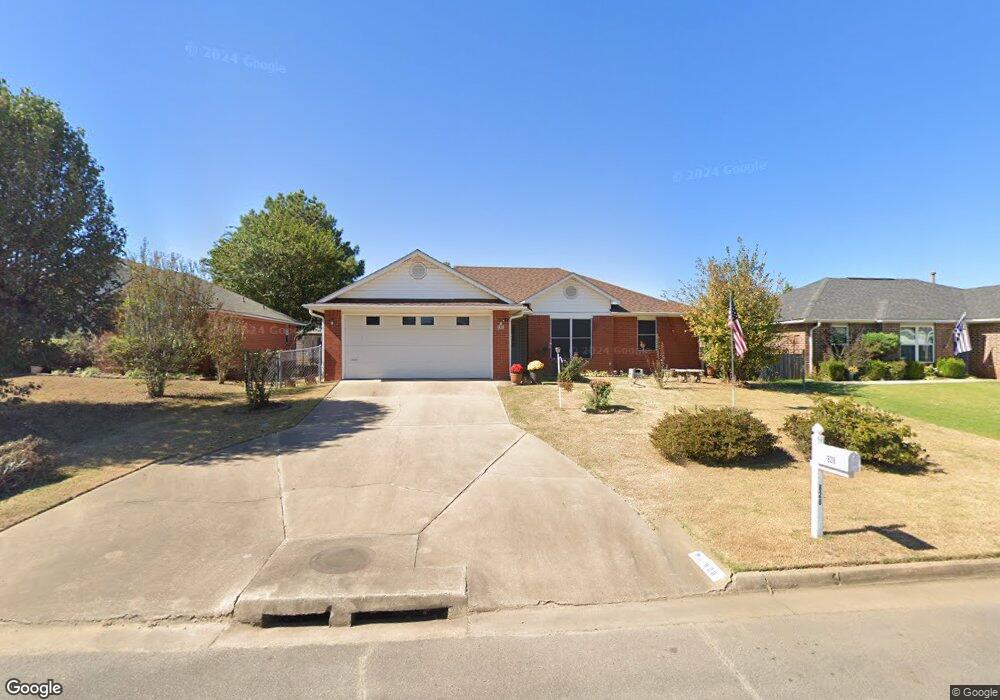
828 S 39th St van Buren, AR 72956
Estimated Value: $162,756 - $190,000
--
Bed
2
Baths
1,226
Sq Ft
$141/Sq Ft
Est. Value
About This Home
This home is located at 828 S 39th St, van Buren, AR 72956 and is currently estimated at $172,439, approximately $140 per square foot. 828 S 39th St is a home located in Crawford County with nearby schools including King Elementary School, Butterfield Trail Middle School, and Van Buren High School.
Ownership History
Date
Name
Owned For
Owner Type
Purchase Details
Closed on
Jun 7, 2023
Sold by
Barlee Properties Ii Limited Partnership
Bought by
Sequoyah Homes Llc and Wines Holdings Arkansas Llc
Current Estimated Value
Purchase Details
Closed on
May 26, 2010
Sold by
Dinh Hanriver and Nguyen Sophia
Bought by
Vandinh Viet Van
Purchase Details
Closed on
Feb 2, 2001
Sold by
Dinh Hanriver and Nguyen Sophia
Bought by
Dinh Hanriver and Nguyen Sophia
Purchase Details
Closed on
Oct 5, 1994
Bought by
Rogers-Dinh and Nguyen
Purchase Details
Closed on
Jul 18, 1994
Bought by
Young-Rogers
Create a Home Valuation Report for This Property
The Home Valuation Report is an in-depth analysis detailing your home's value as well as a comparison with similar homes in the area
Home Values in the Area
Average Home Value in this Area
Purchase History
| Date | Buyer | Sale Price | Title Company |
|---|---|---|---|
| Sequoyah Homes Llc | $1,095,500 | -- | |
| Vandinh Viet Van | -- | -- | |
| Dinh Hanriver | -- | -- | |
| Rogers-Dinh | $56,000 | -- | |
| Young-Rogers | $7,000 | -- |
Source: Public Records
Tax History Compared to Growth
Tax History
| Year | Tax Paid | Tax Assessment Tax Assessment Total Assessment is a certain percentage of the fair market value that is determined by local assessors to be the total taxable value of land and additions on the property. | Land | Improvement |
|---|---|---|---|---|
| 2025 | $363 | $30,270 | $2,000 | $28,270 |
| 2024 | $421 | $30,270 | $2,000 | $28,270 |
| 2023 | $455 | $30,270 | $2,000 | $28,270 |
| 2022 | $463 | $16,140 | $2,000 | $14,140 |
| 2021 | $463 | $16,140 | $2,000 | $14,140 |
| 2020 | $463 | $16,140 | $2,000 | $14,140 |
| 2019 | $463 | $16,140 | $2,000 | $14,140 |
| 2018 | $488 | $16,140 | $2,000 | $14,140 |
| 2017 | $534 | $17,040 | $2,000 | $15,040 |
| 2016 | $534 | $17,040 | $2,000 | $15,040 |
| 2015 | $483 | $17,040 | $2,000 | $15,040 |
| 2014 | $483 | $17,040 | $2,000 | $15,040 |
Source: Public Records
Map
Nearby Homes