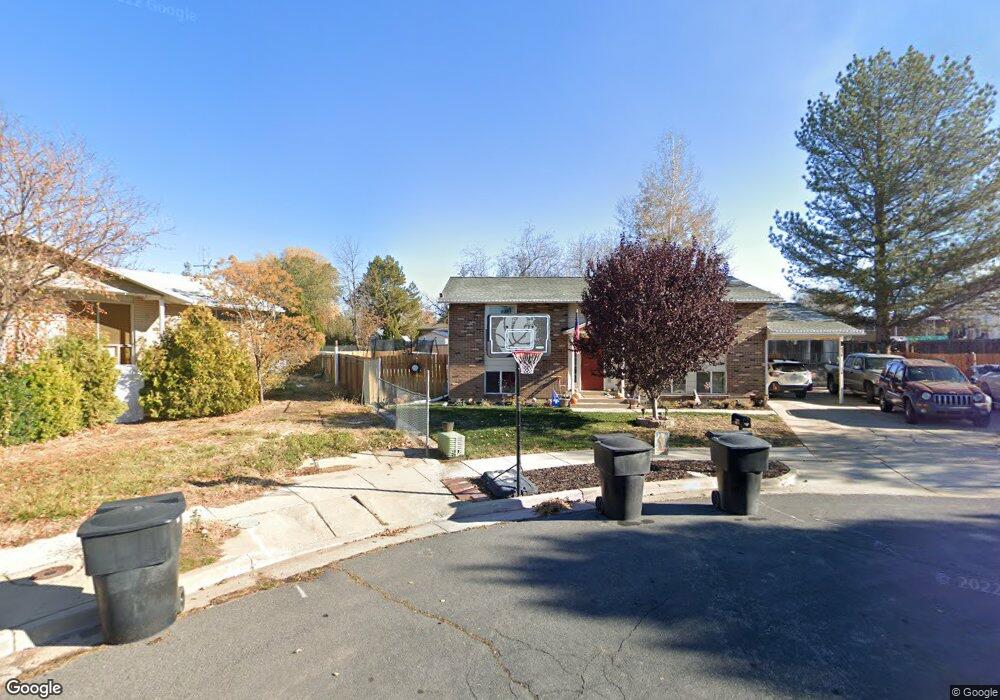
828 W 2600 N Clearfield, UT 84015
Estimated Value: $406,000 - $430,000
4
Beds
2
Baths
2,100
Sq Ft
$199/Sq Ft
Est. Value
About This Home
This home is located at 828 W 2600 N, Clearfield, UT 84015 and is currently estimated at $416,864, approximately $198 per square foot. 828 W 2600 N is a home located in Davis County with nearby schools including Fremont School, Sunset Junior High School, and Northridge High School.
Ownership History
Date
Name
Owned For
Owner Type
Purchase Details
Closed on
Aug 19, 2013
Sold by
Ma & Ba Investments Llc
Bought by
Manning Melissa F and Manning Broch G
Current Estimated Value
Home Financials for this Owner
Home Financials are based on the most recent Mortgage that was taken out on this home.
Original Mortgage
$157,003
Outstanding Balance
$118,958
Interest Rate
4.87%
Mortgage Type
FHA
Estimated Equity
$297,906
Purchase Details
Closed on
Apr 4, 2013
Sold by
Hardman Don E and Hardman Patsy M
Bought by
Ma & Ba Investments Llc
Purchase Details
Closed on
Oct 14, 2009
Sold by
Hardman Don E and Hardman Patsy M
Bought by
Hardman Don E and Hardman Patsy M
Purchase Details
Closed on
Oct 18, 2007
Sold by
Mpad Inc
Bought by
Hardman Don E and Hardman Patsy M
Home Financials for this Owner
Home Financials are based on the most recent Mortgage that was taken out on this home.
Original Mortgage
$150,300
Interest Rate
6.42%
Mortgage Type
Purchase Money Mortgage
Purchase Details
Closed on
Aug 24, 2007
Sold by
Smith Hilling Samantha
Bought by
Armstrong Pauline
Home Financials for this Owner
Home Financials are based on the most recent Mortgage that was taken out on this home.
Original Mortgage
$150,300
Interest Rate
6.42%
Mortgage Type
Purchase Money Mortgage
Purchase Details
Closed on
Sep 29, 2004
Sold by
Green Diane K
Bought by
Smith Hilling Samantha
Home Financials for this Owner
Home Financials are based on the most recent Mortgage that was taken out on this home.
Original Mortgage
$99,900
Interest Rate
6.12%
Mortgage Type
Purchase Money Mortgage
Purchase Details
Closed on
Dec 21, 2000
Sold by
Green Cory D
Bought by
Green Diane K
Home Financials for this Owner
Home Financials are based on the most recent Mortgage that was taken out on this home.
Original Mortgage
$50,000
Interest Rate
7.45%
Purchase Details
Closed on
Nov 17, 2000
Sold by
Green Shanna
Bought by
Green Cory D
Home Financials for this Owner
Home Financials are based on the most recent Mortgage that was taken out on this home.
Original Mortgage
$50,000
Interest Rate
7.45%
Create a Home Valuation Report for This Property
The Home Valuation Report is an in-depth analysis detailing your home's value as well as a comparison with similar homes in the area
Home Values in the Area
Average Home Value in this Area
Purchase History
| Date | Buyer | Sale Price | Title Company |
|---|---|---|---|
| Manning Melissa F | -- | Charger Title Ins Ag | |
| Ma & Ba Investments Llc | -- | Charger Title Ins Agency | |
| Hardman Don E | -- | Title West Title Co Orem | |
| Hardman Don E | -- | Founders Title Co Layton | |
| Mpad Inc | -- | Founders Title Co Layton | |
| Armstrong Pauline | $119,000 | None Available | |
| Smith Hilling Samantha | -- | Bonneville Title Company Inc | |
| Green Diane K | -- | Bonneville Title Company Inc | |
| Green Cory D | -- | Bonneville Title Company Inc |
Source: Public Records
Mortgage History
| Date | Status | Borrower | Loan Amount |
|---|---|---|---|
| Open | Manning Melissa F | $157,003 | |
| Previous Owner | Hardman Don E | $150,300 | |
| Previous Owner | Smith Hilling Samantha | $99,900 | |
| Previous Owner | Green Diane K | $50,000 | |
| Closed | Smith Hilling Samantha | $24,950 |
Source: Public Records
Tax History Compared to Growth
Tax History
| Year | Tax Paid | Tax Assessment Tax Assessment Total Assessment is a certain percentage of the fair market value that is determined by local assessors to be the total taxable value of land and additions on the property. | Land | Improvement |
|---|---|---|---|---|
| 2025 | $2,151 | $206,800 | $113,871 | $92,929 |
| 2024 | $2,111 | $204,050 | $123,047 | $81,003 |
| 2023 | $1,940 | $347,000 | $143,732 | $203,268 |
| 2022 | $2,051 | $202,950 | $83,412 | $119,538 |
| 2021 | $1,874 | $275,000 | $112,119 | $162,881 |
| 2020 | $1,611 | $234,000 | $99,586 | $134,414 |
| 2019 | $1,572 | $223,000 | $108,473 | $114,527 |
| 2018 | $1,492 | $208,000 | $90,631 | $117,369 |
| 2016 | $1,262 | $90,860 | $36,155 | $54,705 |
| 2015 | $1,235 | $84,535 | $36,155 | $48,380 |
| 2014 | $1,183 | $82,225 | $36,155 | $46,070 |
| 2013 | -- | $78,982 | $26,945 | $52,037 |
Source: Public Records
Map
Nearby Homes