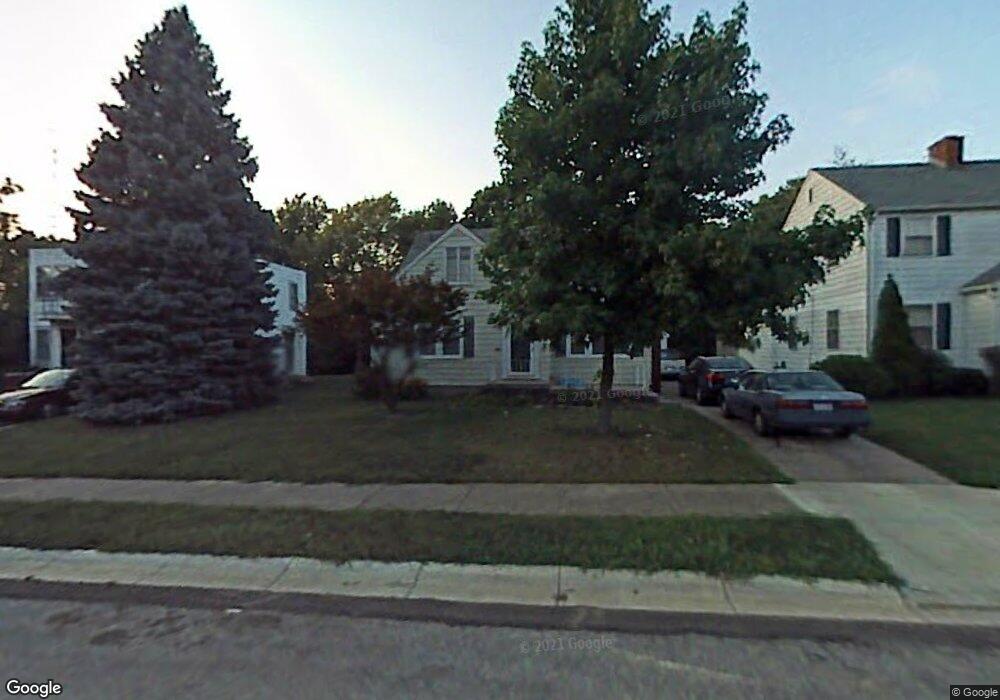
828 W 2nd St Springfield, OH 45504
Estimated Value: $173,000 - $216,000
3
Beds
1
Bath
1,467
Sq Ft
$134/Sq Ft
Est. Value
About This Home
This home is located at 828 W 2nd St, Springfield, OH 45504 and is currently estimated at $197,022, approximately $134 per square foot. 828 W 2nd St is a home located in Clark County with nearby schools including Snowhill Elementary School, Roosevelt Middle School, and Springfield High School.
Ownership History
Date
Name
Owned For
Owner Type
Purchase Details
Closed on
Jan 26, 2007
Sold by
Cox Staci L and Cox Justin L
Bought by
Cox James W and Cox Connie J
Current Estimated Value
Home Financials for this Owner
Home Financials are based on the most recent Mortgage that was taken out on this home.
Original Mortgage
$110,000
Outstanding Balance
$65,995
Interest Rate
6.19%
Mortgage Type
Purchase Money Mortgage
Estimated Equity
$131,027
Purchase Details
Closed on
Jul 31, 2001
Sold by
Lynn Shifman Amy
Bought by
Cox Justin L and Cox Staci L
Home Financials for this Owner
Home Financials are based on the most recent Mortgage that was taken out on this home.
Original Mortgage
$94,161
Interest Rate
7.14%
Mortgage Type
FHA
Purchase Details
Closed on
Feb 3, 1997
Sold by
Lyons Richard L
Bought by
Shifman Amy L
Home Financials for this Owner
Home Financials are based on the most recent Mortgage that was taken out on this home.
Original Mortgage
$81,595
Interest Rate
7.81%
Mortgage Type
FHA
Create a Home Valuation Report for This Property
The Home Valuation Report is an in-depth analysis detailing your home's value as well as a comparison with similar homes in the area
Home Values in the Area
Average Home Value in this Area
Purchase History
| Date | Buyer | Sale Price | Title Company |
|---|---|---|---|
| Cox James W | $110,000 | None Available | |
| Cox Justin L | $95,000 | -- | |
| Shifman Amy L | $82,000 | -- |
Source: Public Records
Mortgage History
| Date | Status | Borrower | Loan Amount |
|---|---|---|---|
| Open | Cox James W | $110,000 | |
| Closed | Cox Justin L | $94,161 | |
| Closed | Shifman Amy L | $81,595 |
Source: Public Records
Tax History Compared to Growth
Tax History
| Year | Tax Paid | Tax Assessment Tax Assessment Total Assessment is a certain percentage of the fair market value that is determined by local assessors to be the total taxable value of land and additions on the property. | Land | Improvement |
|---|---|---|---|---|
| 2024 | $2,019 | $41,900 | $7,320 | $34,580 |
| 2023 | $2,019 | $41,900 | $7,320 | $34,580 |
| 2022 | $2,068 | $41,900 | $7,320 | $34,580 |
| 2021 | $1,522 | $28,470 | $5,630 | $22,840 |
| 2020 | $1,526 | $28,470 | $5,630 | $22,840 |
| 2019 | $1,529 | $28,470 | $5,630 | $22,840 |
| 2018 | $1,735 | $31,030 | $4,900 | $26,130 |
| 2017 | $1,734 | $33,821 | $4,897 | $28,924 |
| 2016 | $1,737 | $33,821 | $4,897 | $28,924 |
| 2015 | $1,767 | $33,821 | $4,897 | $28,924 |
| 2014 | $1,759 | $33,821 | $4,897 | $28,924 |
| 2013 | $1,740 | $33,821 | $4,897 | $28,924 |
Source: Public Records
Map
Nearby Homes