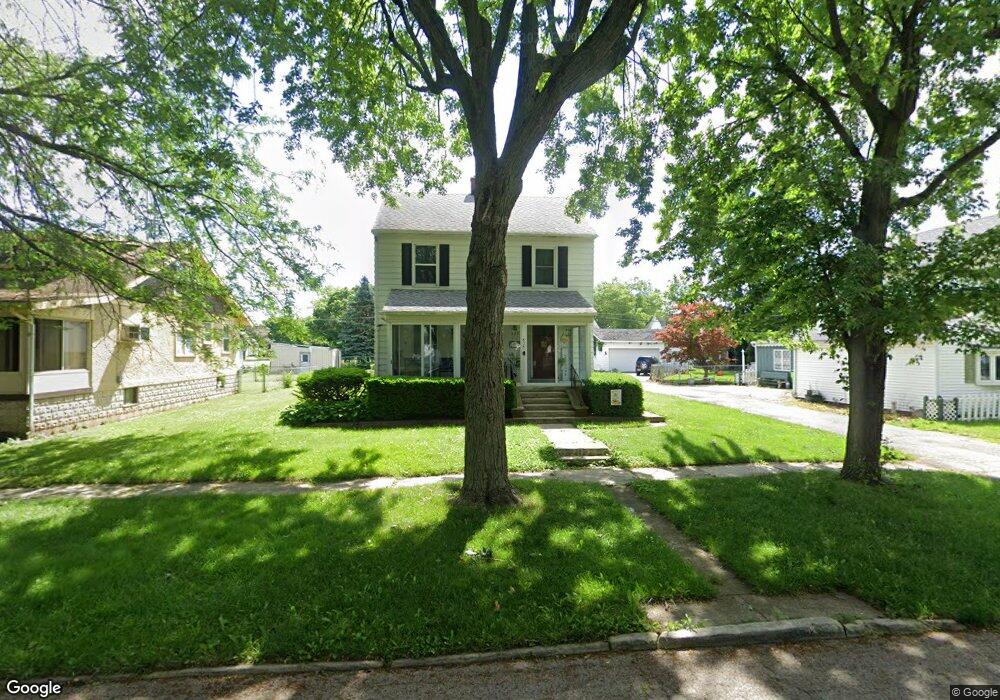
828 Walnut St Fostoria, OH 44830
Estimated Value: $108,000 - $156,833
3
Beds
2
Baths
1,442
Sq Ft
$91/Sq Ft
Est. Value
About This Home
This home is located at 828 Walnut St, Fostoria, OH 44830 and is currently estimated at $130,708, approximately $90 per square foot. 828 Walnut St is a home located in Seneca County with nearby schools including Fostoria Intermediate Elementary School and Fostoria Junior/Senior High School.
Ownership History
Date
Name
Owned For
Owner Type
Purchase Details
Closed on
Dec 28, 2023
Sold by
Clay Doyle E
Bought by
Clay Doyle E and Gangwer Vickie L
Current Estimated Value
Purchase Details
Closed on
Dec 7, 2012
Sold by
Lichtle Lola M and Burns Jane M
Bought by
Clay Doyle E
Purchase Details
Closed on
Jan 22, 2010
Sold by
Lichtle Lola M
Bought by
Lichtle Lola M
Purchase Details
Closed on
Mar 20, 2002
Sold by
Lichtle Lola M
Bought by
Lichtle Lola M Trustee
Purchase Details
Closed on
Jan 31, 1997
Sold by
Lichtle Lola M
Bought by
Lichtle Lola M
Create a Home Valuation Report for This Property
The Home Valuation Report is an in-depth analysis detailing your home's value as well as a comparison with similar homes in the area
Home Values in the Area
Average Home Value in this Area
Purchase History
| Date | Buyer | Sale Price | Title Company |
|---|---|---|---|
| Clay Doyle E | -- | None Listed On Document | |
| Clay Doyle E | -- | None Listed On Document | |
| Clay Doyle E | $31,000 | None Available | |
| Lichtle Lola M | -- | None Available | |
| Lichtle Lola M Trustee | -- | -- | |
| Lichtle Lola M | -- | -- |
Source: Public Records
Tax History Compared to Growth
Tax History
| Year | Tax Paid | Tax Assessment Tax Assessment Total Assessment is a certain percentage of the fair market value that is determined by local assessors to be the total taxable value of land and additions on the property. | Land | Improvement |
|---|---|---|---|---|
| 2024 | $2,006 | $38,900 | $6,100 | $32,800 |
| 2023 | $2,010 | $38,900 | $6,100 | $32,800 |
| 2022 | $1,590 | $27,400 | $5,060 | $22,340 |
| 2021 | $1,624 | $27,400 | $5,060 | $22,340 |
| 2020 | $1,597 | $27,398 | $5,061 | $22,337 |
| 2019 | $1,519 | $25,848 | $4,886 | $20,962 |
| 2018 | $1,548 | $25,848 | $4,886 | $20,962 |
| 2017 | $1,547 | $25,848 | $4,886 | $20,962 |
| 2016 | $1,342 | $25,117 | $4,967 | $20,150 |
| 2015 | $1,319 | $25,117 | $4,967 | $20,150 |
| 2014 | $1,255 | $25,117 | $4,967 | $20,150 |
| 2013 | $1,468 | $27,209 | $5,397 | $21,812 |
Source: Public Records
Map
Nearby Homes
- 931 N Union St
- 207 W Culbertson St
- 892 N Countyline St
- 900 N Countyline St
- 723 N Union St
- 633 Maple St
- 520 N Union St
- 1324 N Union St
- 540 N Poplar St
- 375 Thomas St
- 220 E High St
- 901 Central Ave
- 827 Buckley St
- 603 N Vine St
- 727 Eisenhower Dr
- 203 N Union St
- 711 Circle Dr
- 509 College Ave
- 481 Beverly Dr
- 348 W South St