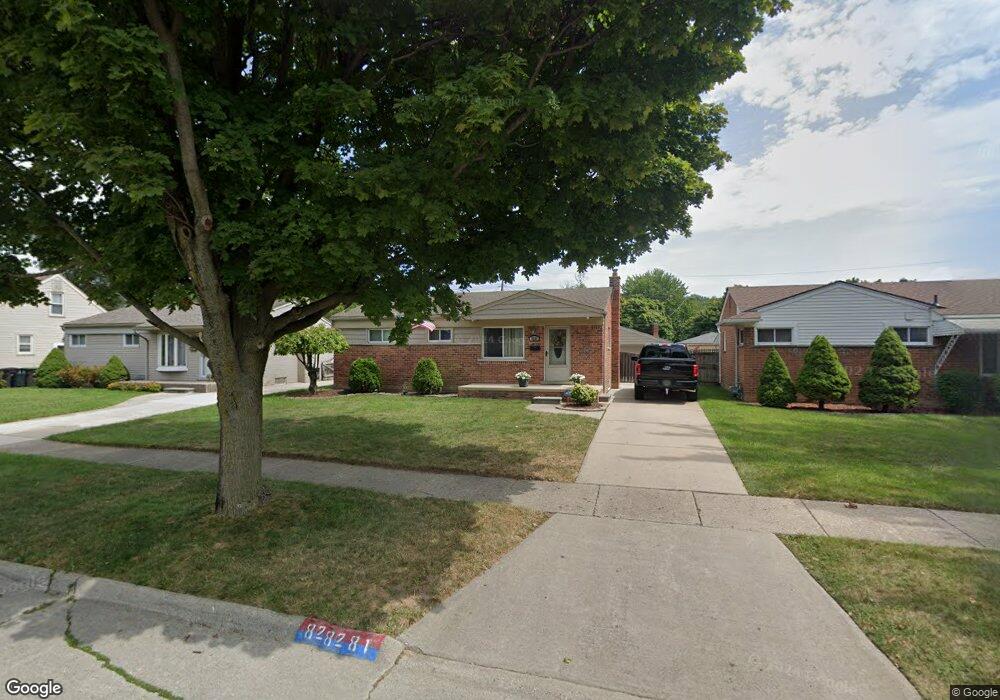
8281 Jackson St Taylor, MI 48180
Estimated Value: $160,000 - $183,000
3
Beds
1
Bath
910
Sq Ft
$192/Sq Ft
Est. Value
About This Home
This home is located at 8281 Jackson St, Taylor, MI 48180 and is currently estimated at $174,724, approximately $192 per square foot. 8281 Jackson St is a home located in Wayne County with nearby schools including Blair Moody Elementary School, Robert J. West Middle School, and Cabrini Elementary & Middle School.
Ownership History
Date
Name
Owned For
Owner Type
Purchase Details
Closed on
Jan 21, 2011
Sold by
Secretary Of Housing & Urban Development
Bought by
Ford Stacey J
Current Estimated Value
Purchase Details
Closed on
Jun 7, 2010
Sold by
Midfirst Bank
Bought by
The Secretary Of Housing & Urban Develop
Purchase Details
Closed on
Dec 3, 2009
Sold by
Adams Dwayne
Bought by
Midfirst Bank
Purchase Details
Closed on
Jun 6, 2005
Sold by
Adams Dwayne and Estate Of Archie Biggs
Bought by
Biggs Joyce L
Purchase Details
Closed on
Oct 25, 2002
Sold by
Household Finance Corp I
Bought by
Adams Dwayne
Purchase Details
Closed on
Dec 12, 2001
Sold by
Jenkins Gary A
Bought by
Norwest Mtg Inc
Purchase Details
Closed on
Aug 29, 2001
Sold by
Jenkins Gary A
Bought by
Household Finance Corp Iii
Purchase Details
Closed on
May 3, 1996
Sold by
Jenkins Gary A and Jenkins Tammy M
Bought by
Thompson Brent K and Thompson Carolyn M
Create a Home Valuation Report for This Property
The Home Valuation Report is an in-depth analysis detailing your home's value as well as a comparison with similar homes in the area
Home Values in the Area
Average Home Value in this Area
Purchase History
| Date | Buyer | Sale Price | Title Company |
|---|---|---|---|
| Ford Stacey J | $41,000 | None Available | |
| The Secretary Of Housing & Urban Develop | -- | None Available | |
| Midfirst Bank | $114,689 | None Available | |
| Biggs Joyce L | $12,000 | Minnesota Title Agency | |
| Adams Dwayne | $115,000 | -- | |
| Norwest Mtg Inc | $73,156 | -- | |
| Household Finance Corp Iii | $111,250 | -- | |
| Thompson Brent K | $70,000 | -- |
Source: Public Records
Tax History
| Year | Tax Paid | Tax Assessment Tax Assessment Total Assessment is a certain percentage of the fair market value that is determined by local assessors to be the total taxable value of land and additions on the property. | Land | Improvement |
|---|---|---|---|---|
| 2025 | $1,921 | $85,500 | $0 | $0 |
| 2024 | $1,860 | $81,800 | $0 | $0 |
| 2023 | $2,219 | $72,100 | $0 | $0 |
| 2022 | $1,775 | $64,100 | $0 | $0 |
| 2021 | $1,952 | $57,800 | $0 | $0 |
| 2020 | $1,933 | $55,300 | $0 | $0 |
| 2019 | $193,203 | $47,700 | $0 | $0 |
| 2018 | $1,524 | $38,700 | $0 | $0 |
| 2017 | $823 | $37,800 | $0 | $0 |
| 2016 | $1,882 | $36,700 | $0 | $0 |
| 2015 | $3,444 | $34,800 | $0 | $0 |
| 2013 | $3,430 | $34,900 | $0 | $0 |
| 2012 | $1,504 | $35,000 | $11,200 | $23,800 |
Source: Public Records
Map
Nearby Homes
- 8711 Jackson St
- 20234 Champaign St
- 8281 Huron St
- 7854 Jackson St
- 20548 Lockwood St
- 7972 Hipp St
- 9127 Weddel St
- 9134 Weddel St
- 7580 Mayfair St
- 20812 Wick Rd
- 8098 Winona Ave
- 7179 Ziegler St
- 7210 Buckingham Ave
- 7124 Weddel St
- 7120 Jackson St
- 18650 Grey Ave
- 21059 Wick Rd
- 9444 Polk St
- 7882 Campbell St
- 8953 William St
- 8271 Jackson St
- 8291 Jackson St
- 8261 Jackson St Unit Bldg-Unit
- 8261 Jackson St
- 8303 Jackson St
- 8278 Ziegler St
- 8290 Ziegler St
- 8270 Ziegler St
- 8251 Jackson St
- 8315 Jackson St
- 8302 Ziegler St
- 8262 Ziegler St
- 8241 Jackson St
- 8252 Ziegler St
- 8282 Jackson St
- 8312 Ziegler St
- 8292 Jackson St
- 8272 Jackson St
- 8325 Jackson St
- 8304 Jackson St
Your Personal Tour Guide
Ask me questions while you tour the home.