Estimated Value: $420,000 - $459,271
4
Beds
4
Baths
1,955
Sq Ft
$227/Sq Ft
Est. Value
About This Home
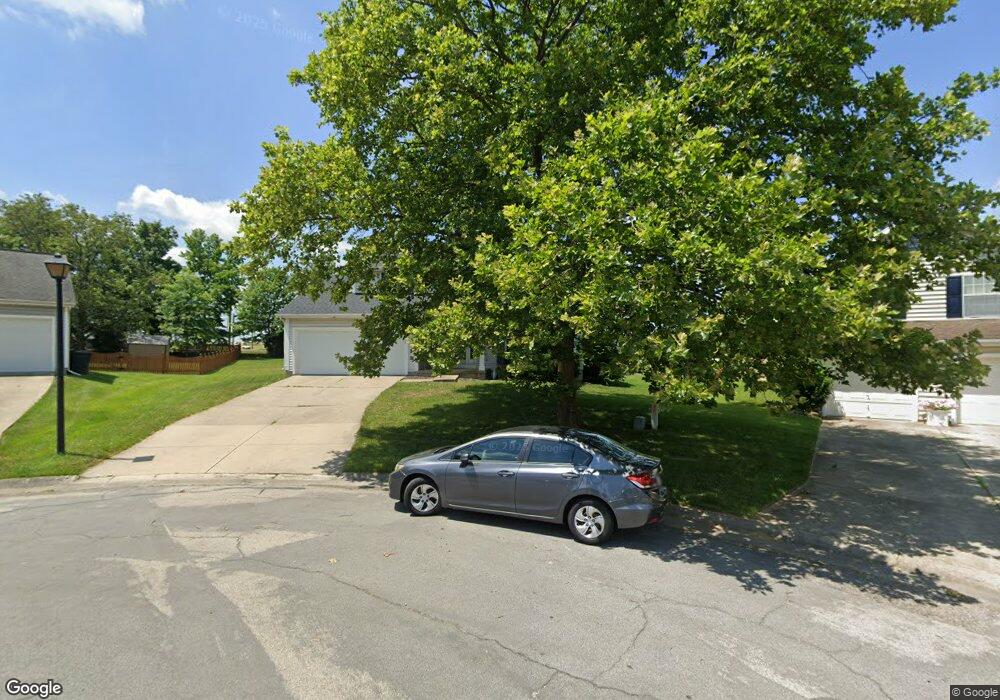
This home is located at 8283 Winters Ln, Mason, OH 45040 and is currently estimated at $444,318, approximately $227 per square foot. 8283 Winters Ln is a home located in Warren County with nearby schools including Mason Intermediate Elementary School, Mason Middle School, and William Mason High School.
Ownership History
Date
Name
Owned For
Owner Type
Purchase Details
Closed on
Apr 29, 2004
Sold by
Wainscott Barbara L and Wainscott Samuel D
Bought by
Benton Christopher J and Benton Jennifer A
Current Estimated Value
Home Financials for this Owner
Home Financials are based on the most recent Mortgage that was taken out on this home.
Original Mortgage
$151,215
Outstanding Balance
$68,206
Interest Rate
5.5%
Mortgage Type
Purchase Money Mortgage
Estimated Equity
$376,112
Purchase Details
Closed on
Aug 30, 2000
Sold by
Buell Michael W
Bought by
Wainscott Barbara and Wainscott Samuel
Home Financials for this Owner
Home Financials are based on the most recent Mortgage that was taken out on this home.
Original Mortgage
$159,018
Interest Rate
8.26%
Mortgage Type
VA
Purchase Details
Closed on
Oct 29, 1987
Sold by
Ryan Homes & Inc
Bought by
Buell Buell and Buell Michael W
Purchase Details
Closed on
Jun 23, 1987
Sold by
Mozzone Mozzone and Mozzone Andrew J
Bought by
Ryan Homes & Inc
Purchase Details
Closed on
Jun 2, 1987
Sold by
Mozzone Mozzone and Mozzone Andrew J.Trustee
Bought by
Mozzone Mozzone and Mozzone Andrew J
Create a Home Valuation Report for This Property
The Home Valuation Report is an in-depth analysis detailing your home's value as well as a comparison with similar homes in the area
Home Values in the Area
Average Home Value in this Area
Purchase History
| Date | Buyer | Sale Price | Title Company |
|---|---|---|---|
| Benton Christopher J | $177,900 | -- | |
| Wainscott Barbara | $155,900 | -- | |
| Buell Buell | $93,200 | -- | |
| Ryan Homes & Inc | $15,800 | -- | |
| Mozzone Mozzone | -- | -- |
Source: Public Records
Mortgage History
| Date | Status | Borrower | Loan Amount |
|---|---|---|---|
| Open | Benton Christopher J | $151,215 | |
| Previous Owner | Wainscott Barbara | $159,018 |
Source: Public Records
Tax History
| Year | Tax Paid | Tax Assessment Tax Assessment Total Assessment is a certain percentage of the fair market value that is determined by local assessors to be the total taxable value of land and additions on the property. | Land | Improvement |
|---|---|---|---|---|
| 2025 | $5,420 | $126,480 | $31,500 | $94,980 |
| 2024 | $5,420 | $126,480 | $31,500 | $94,980 |
| 2023 | $5,140 | $98,826 | $16,800 | $82,026 |
| 2022 | $5,051 | $98,826 | $16,800 | $82,026 |
| 2021 | $4,805 | $98,826 | $16,800 | $82,026 |
| 2020 | $4,716 | $82,355 | $14,000 | $68,355 |
| 2019 | $4,371 | $82,355 | $14,000 | $68,355 |
| 2018 | $4,349 | $82,355 | $14,000 | $68,355 |
| 2017 | $3,919 | $67,764 | $12,807 | $54,957 |
| 2016 | $4,028 | $67,764 | $12,807 | $54,957 |
| 2015 | $3,998 | $67,764 | $12,807 | $54,957 |
| 2014 | $3,732 | $58,420 | $11,040 | $47,380 |
| 2013 | $3,740 | $74,090 | $14,000 | $60,090 |
Source: Public Records
Map
Nearby Homes
- 6978 Fallen Oaks Dr
- 9582 Opal Ln
- 8588 Charleston Creek Dr
- 8820 Butler Warren Rd
- 8830 Butler Warren Rd
- 6589 Quail Lake
- 6713 Quail Lake
- 6315 Greenwood Ct
- 6285 Greenwood Ct
- 9509 Butler Warren Rd
- 6304 Trailwood Ct
- 9286 Westchester Park Ct
- 7771 Jonathan Ct
- 8175 Sunburst Dr
- 9621 Iris Dr
- 8770 Cox Rd
- 8698 Cox Rd
- 8121 Barret Rd
- 9917 Shorewood Ln
- 7953 Quebec Ct
- 8286 Winters Ln
- 8275 Winters Ln
- 8263 Winters Ln
- 8284 Winters Ln
- 8280 Winters Ln
- 8251 Winters Ln
- 8268 Winters Ln
- 8256 Winters Ln
- 6980 Autumn Mist Ct
- 6947 Socialville Foster Rd
- 8241 Winters Ln
- 8256 Indian Summer Way
- 8246 Winters Ln
- 8254 Indian Summer Way
- 8229 Winters Ln
- 8255 Indian Summer Way
- 8234 Winters Ln
- 6909 Socialville Foster Rd
- 6910 Pin Oak Ct
- 8217 Winters Ln
Your Personal Tour Guide
Ask me questions while you tour the home.