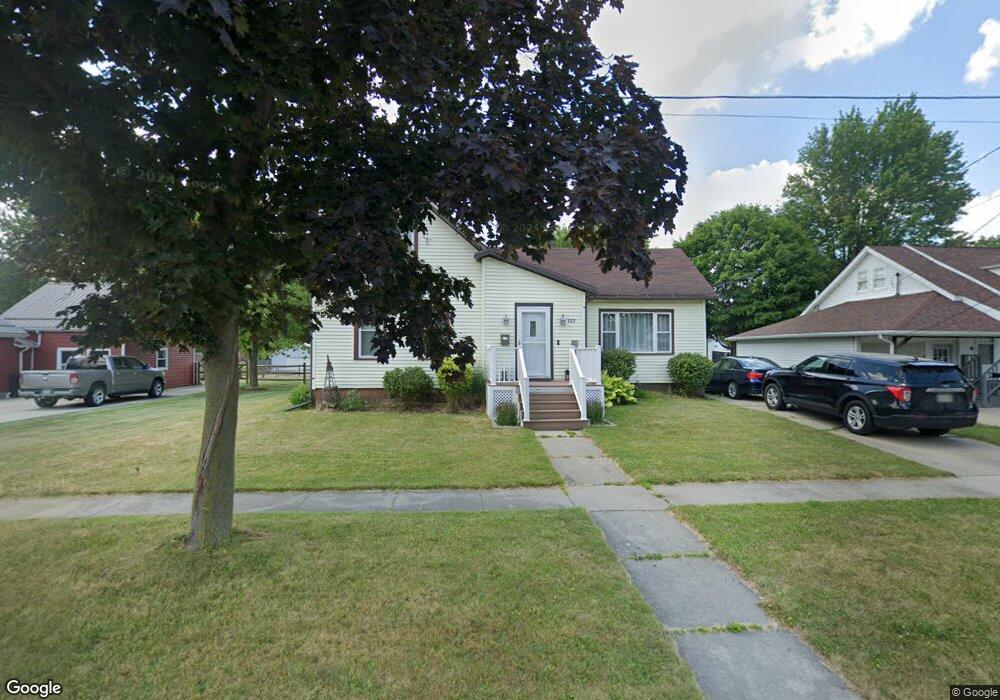
829 3rd St Wauseon, OH 43567
Estimated Value: $127,622 - $155,000
3
Beds
1
Bath
1,088
Sq Ft
$125/Sq Ft
Est. Value
About This Home
This home is located at 829 3rd St, Wauseon, OH 43567 and is currently estimated at $136,156, approximately $125 per square foot. 829 3rd St is a home located in Fulton County with nearby schools including Wauseon Primary School, Wauseon Elementary School, and Wauseon Middle School.
Ownership History
Date
Name
Owned For
Owner Type
Purchase Details
Closed on
Sep 13, 2005
Sold by
Stereff Christopher P and Stereff Virginia L
Bought by
Smith Robert W and Smith Laura A
Current Estimated Value
Home Financials for this Owner
Home Financials are based on the most recent Mortgage that was taken out on this home.
Original Mortgage
$76,800
Outstanding Balance
$41,295
Interest Rate
5.93%
Mortgage Type
Fannie Mae Freddie Mac
Estimated Equity
$94,861
Purchase Details
Closed on
Jan 30, 2003
Sold by
Blaker Judson and Blaker Melissa
Bought by
Stereff Christopher P and Stereff Virginia L
Purchase Details
Closed on
Feb 9, 2000
Sold by
Parker Michael
Bought by
Blaker Judson
Home Financials for this Owner
Home Financials are based on the most recent Mortgage that was taken out on this home.
Original Mortgage
$64,000
Interest Rate
8.08%
Mortgage Type
New Conventional
Purchase Details
Closed on
Jan 1, 1990
Bought by
Spiess Cindy Lynn
Create a Home Valuation Report for This Property
The Home Valuation Report is an in-depth analysis detailing your home's value as well as a comparison with similar homes in the area
Home Values in the Area
Average Home Value in this Area
Purchase History
| Date | Buyer | Sale Price | Title Company |
|---|---|---|---|
| Smith Robert W | $96,000 | -- | |
| Stereff Christopher P | $22,000 | Louisville Title | |
| Blaker Judson | $67,000 | -- | |
| Spiess Cindy Lynn | -- | -- |
Source: Public Records
Mortgage History
| Date | Status | Borrower | Loan Amount |
|---|---|---|---|
| Open | Smith Robert W | $76,800 | |
| Previous Owner | Blaker Judson | $64,000 |
Source: Public Records
Tax History
| Year | Tax Paid | Tax Assessment Tax Assessment Total Assessment is a certain percentage of the fair market value that is determined by local assessors to be the total taxable value of land and additions on the property. | Land | Improvement |
|---|---|---|---|---|
| 2024 | $1,657 | $33,670 | $7,980 | $25,690 |
| 2023 | $1,711 | $33,670 | $7,980 | $25,690 |
| 2022 | $1,536 | $25,690 | $6,650 | $19,040 |
| 2021 | $1,626 | $25,690 | $6,650 | $19,040 |
| 2020 | $1,510 | $25,690 | $6,650 | $19,040 |
| 2019 | $1,443 | $24,190 | $6,650 | $17,540 |
| 2018 | $1,278 | $24,190 | $6,650 | $17,540 |
| 2017 | $1,261 | $24,190 | $6,650 | $17,540 |
| 2016 | $1,236 | $21,320 | $6,650 | $14,670 |
| 2015 | $1,161 | $21,320 | $6,650 | $14,670 |
| 2014 | $1,105 | $21,320 | $6,650 | $14,670 |
| 2013 | $1,480 | $26,400 | $5,710 | $20,690 |
Source: Public Records
Map
Nearby Homes
- 833 3rd St
- 351 E Walnut St
- 203 E Oak St
- 607 E Elm St
- 234 W Chestnut St
- 1338 N Park Ln
- 252 W Chestnut St
- 263 W Chestnut St
- 239 W Chestnut St
- 840 Pine St
- 460 Airport Hwy
- 594 Douglas Dr
- 14578 Us Highway 20a
- 622 Vine St
- 420 Clover Ln
- 760 Airport Hwy
- 1171 Apache Dr
- 1066 Seneca Dr
- 1062 Seneca Dr
- Integrity 1830 Plan at Arrowhead Trails
Your Personal Tour Guide
Ask me questions while you tour the home.