Estimated Value: $389,037 - $441,000
4
Beds
3
Baths
2,724
Sq Ft
$152/Sq Ft
Est. Value
About This Home
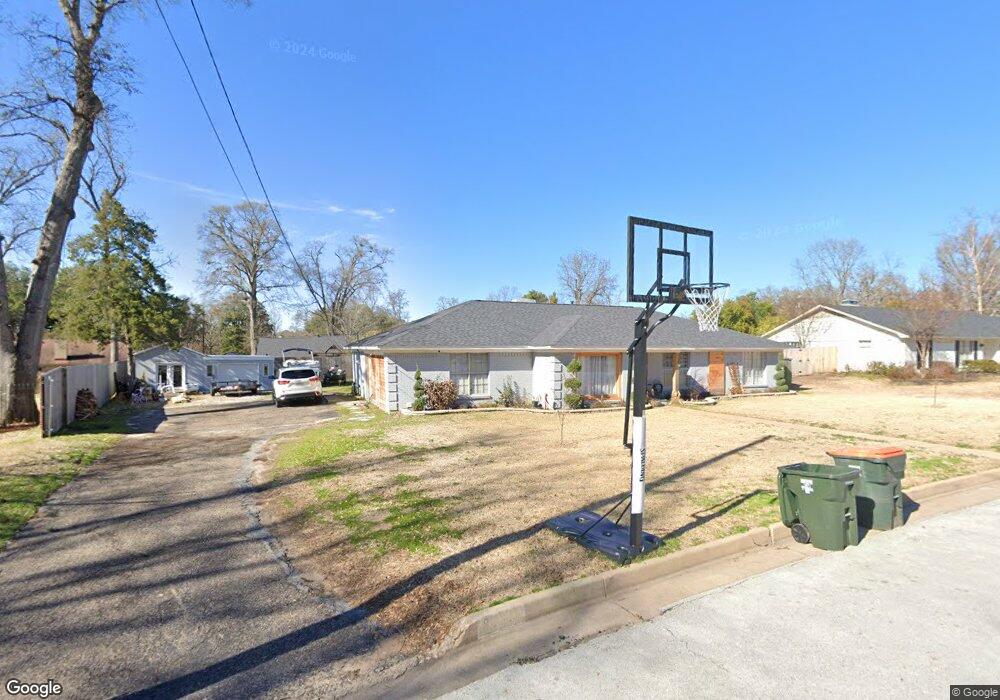
This home is located at 829 829 Barclay, Tyler, TX 75703 and is currently estimated at $413,009, approximately $151 per square foot. 829 829 Barclay is a home located in Smith County with nearby schools including Rice Elementary School, Hubbard Middle School, and Tyler Legacy High School.
Ownership History
Date
Name
Owned For
Owner Type
Purchase Details
Closed on
Apr 26, 2024
Sold by
Grimes Lindsay and Grimes David
Bought by
Sullivan Mason and Sullivan Laure Michele
Current Estimated Value
Home Financials for this Owner
Home Financials are based on the most recent Mortgage that was taken out on this home.
Original Mortgage
$319,900
Outstanding Balance
$314,688
Interest Rate
6.74%
Mortgage Type
New Conventional
Estimated Equity
$98,321
Purchase Details
Closed on
Feb 26, 2018
Sold by
Montes Miguel
Bought by
Grimes Lindsay and Grimes David
Home Financials for this Owner
Home Financials are based on the most recent Mortgage that was taken out on this home.
Original Mortgage
$160,800
Interest Rate
4.4%
Mortgage Type
Purchase Money Mortgage
Purchase Details
Closed on
Jul 19, 2012
Sold by
Montes Miguel and Montes Luz Maria
Bought by
Miguel Montes Revocable Living Trust and Luz Maria Montes Revocable Living Trust
Create a Home Valuation Report for This Property
The Home Valuation Report is an in-depth analysis detailing your home's value as well as a comparison with similar homes in the area
Home Values in the Area
Average Home Value in this Area
Purchase History
| Date | Buyer | Sale Price | Title Company |
|---|---|---|---|
| Sullivan Mason | -- | None Listed On Document | |
| Grimes Lindsay | -- | None Available | |
| Miguel Montes Revocable Living Trust | -- | None Available |
Source: Public Records
Mortgage History
| Date | Status | Borrower | Loan Amount |
|---|---|---|---|
| Open | Sullivan Mason | $319,900 | |
| Previous Owner | Grimes Lindsay | $160,800 |
Source: Public Records
Tax History Compared to Growth
Tax History
| Year | Tax Paid | Tax Assessment Tax Assessment Total Assessment is a certain percentage of the fair market value that is determined by local assessors to be the total taxable value of land and additions on the property. | Land | Improvement |
|---|---|---|---|---|
| 2025 | $3,436 | $369,928 | $69,620 | $300,308 |
| 2024 | $3,436 | $260,788 | $54,848 | $324,067 |
| 2023 | $4,133 | $296,488 | $54,848 | $241,640 |
| 2022 | $4,223 | $250,477 | $50,392 | $200,085 |
| 2021 | $4,111 | $195,934 | $50,392 | $145,542 |
| 2020 | $4,234 | $197,876 | $50,392 | $147,484 |
| 2019 | $3,842 | $175,705 | $34,280 | $141,425 |
| 2018 | $3,744 | $172,141 | $34,280 | $137,861 |
| 2017 | $3,675 | $172,141 | $34,280 | $137,861 |
| 2016 | $3,504 | $164,140 | $34,280 | $129,860 |
| 2015 | $3,385 | $163,680 | $34,280 | $129,400 |
| 2014 | $3,385 | $159,308 | $34,280 | $125,028 |
Source: Public Records
Map
Nearby Homes
- 429 Holiday Ln
- 418 Boyd Ln
- 7434 Waterview Square
- 6052 N Park Central Ct
- 5106 Cloverdale Dr
- 704 Paloma St
- 4001 Darrell Ln
- 3915 Post Oak Rd
- 842 Carriage Dr
- 601 Carriage Dr
- 3829 Cloverdale Dr
- 1107 Larkspur Ln
- 3903 Appletree Ln
- 802 Carriage Dr
- 604-606 Woodland Hills Dr
- 815 Woodland Hills Dr
- 701 Woodland Hills Dr
- 410 Brighton Ct
- 504 Woodland Hills Dr
- 3606 Glendale Dr
- 829 Barclay Dr
- 821 Barclay Dr
- 821 821 Barclay
- 4601 4601 Barclay Dr
- 4601 Barclay Dr
- 828 Trenton Dr
- 828 828 Trenton
- 820 Trenton Dr
- 4606 Barclay Dr
- 834 Trenton Dr
- 820 820 Barclay Dr
- 820 Barclay Dr
- 834 834 Trenton
- 4607 4607 Barclay
- 904 Trenton Dr
- 4607 Barclay Dr
- 904 904 Trenton Dr
- 725 Barclay Dr
- 725 725 Barclay Dr
- 812 Trenton Dr