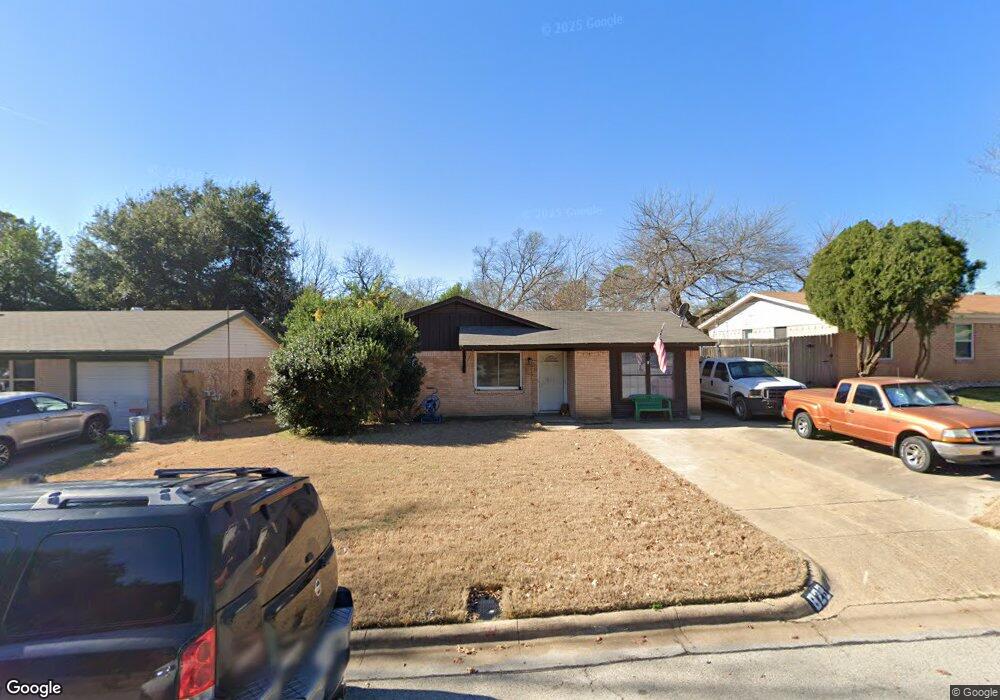
829 Bryan Dr Bedford, TX 76022
Estimated Value: $253,000 - $274,000
3
Beds
2
Baths
1,269
Sq Ft
$206/Sq Ft
Est. Value
About This Home
This home is located at 829 Bryan Dr, Bedford, TX 76022 and is currently estimated at $261,051, approximately $205 per square foot. 829 Bryan Dr is a home located in Tarrant County with nearby schools including Bell Manor Elementary School, Central J High School, and Trinity High School.
Ownership History
Date
Name
Owned For
Owner Type
Purchase Details
Closed on
Apr 10, 2013
Sold by
Ward Alicia D
Bought by
Ward Michael
Current Estimated Value
Purchase Details
Closed on
Apr 22, 2005
Sold by
Rahman Syed M
Bought by
Ward Michael
Home Financials for this Owner
Home Financials are based on the most recent Mortgage that was taken out on this home.
Original Mortgage
$90,286
Outstanding Balance
$47,044
Interest Rate
5.93%
Mortgage Type
FHA
Estimated Equity
$214,007
Purchase Details
Closed on
Nov 21, 2002
Sold by
Hud
Bought by
Rahman Syed M
Home Financials for this Owner
Home Financials are based on the most recent Mortgage that was taken out on this home.
Original Mortgage
$62,000
Interest Rate
6.05%
Purchase Details
Closed on
Apr 18, 2002
Sold by
Countrywide Home Loans Inc
Bought by
Hud
Purchase Details
Closed on
Apr 2, 2002
Sold by
Mcclure Lili L
Bought by
Countrywide Home Loans Inc
Create a Home Valuation Report for This Property
The Home Valuation Report is an in-depth analysis detailing your home's value as well as a comparison with similar homes in the area
Home Values in the Area
Average Home Value in this Area
Purchase History
| Date | Buyer | Sale Price | Title Company |
|---|---|---|---|
| Ward Michael | -- | None Available | |
| Ward Michael | -- | American Title | |
| Rahman Syed M | -- | Fidelity National Title | |
| Hud | -- | -- | |
| Countrywide Home Loans Inc | $75,606 | -- |
Source: Public Records
Mortgage History
| Date | Status | Borrower | Loan Amount |
|---|---|---|---|
| Open | Ward Michael | $90,286 | |
| Previous Owner | Rahman Syed M | $62,000 |
Source: Public Records
Tax History Compared to Growth
Tax History
| Year | Tax Paid | Tax Assessment Tax Assessment Total Assessment is a certain percentage of the fair market value that is determined by local assessors to be the total taxable value of land and additions on the property. | Land | Improvement |
|---|---|---|---|---|
| 2025 | $2,545 | $195,644 | $55,000 | $140,644 |
| 2024 | $2,545 | $236,000 | $55,000 | $181,000 |
| 2023 | $3,322 | $260,874 | $45,000 | $215,874 |
| 2022 | $3,439 | $216,730 | $45,000 | $171,730 |
| 2021 | $3,372 | $183,195 | $45,000 | $138,195 |
| 2020 | $3,094 | $149,517 | $45,000 | $104,517 |
| 2019 | $2,874 | $150,503 | $45,000 | $105,503 |
| 2018 | $2,231 | $107,547 | $14,000 | $93,547 |
| 2017 | $2,623 | $108,413 | $14,000 | $94,413 |
| 2016 | $2,416 | $109,279 | $14,000 | $95,279 |
| 2015 | $2,005 | $90,800 | $14,000 | $76,800 |
| 2014 | $2,005 | $90,800 | $14,000 | $76,800 |
Source: Public Records
Map
Nearby Homes
- 904 Nelson Terrace
- 1604 Richmond Dr
- 1613 Trinity Ct
- 1031 Boston Blvd
- 909 Overhill Dr
- 921 Overhill Dr
- 933 Charleston Ct
- 1004 Overhill Dr
- 952 Charleston Dr
- 1701 Winchester Way
- 804 Natchez Ave
- 1204 Edgecliff Dr
- 832 Chateau Valee Cir
- 2024 Charleston Dr
- 2101 Gettysburg Place
- 1309 Driftwood Dr
- 1200 Tanglewood Trail
- 3905 Shady Creek Dr
- 933 Wade Dr
- 1108 Wade Dr