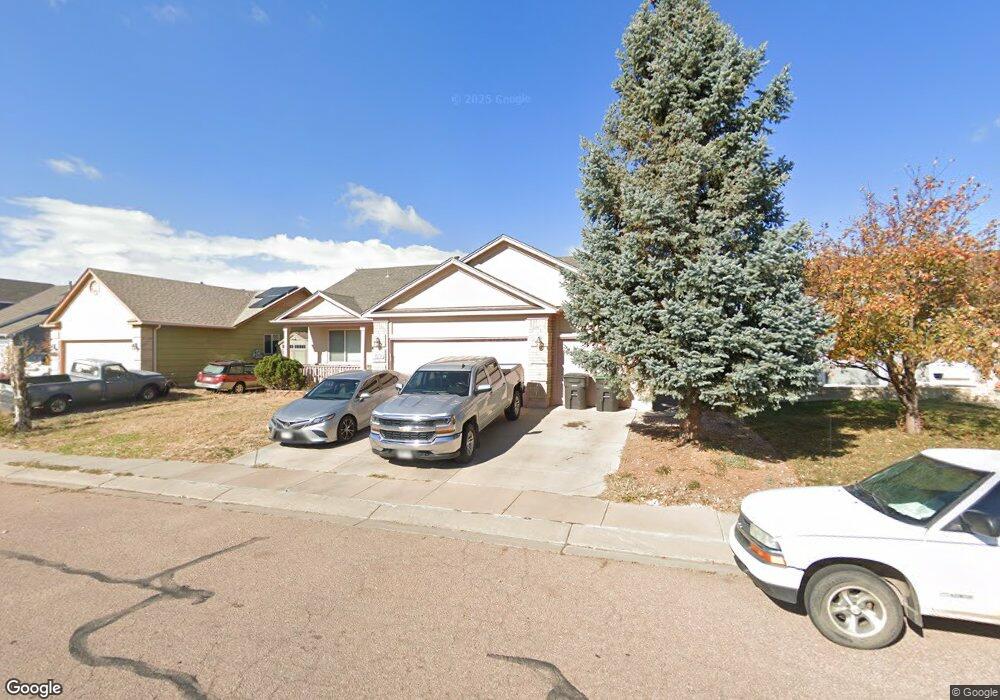
829 Candlestar Loop N Fountain, CO 80817
Central Fountain Valley NeighborhoodEstimated Value: $425,000 - $441,000
4
Beds
3
Baths
2,469
Sq Ft
$176/Sq Ft
Est. Value
About This Home
This home is located at 829 Candlestar Loop N, Fountain, CO 80817 and is currently estimated at $435,482, approximately $176 per square foot. 829 Candlestar Loop N is a home located in El Paso County with nearby schools including Jordahl Elementary School, Fountain Middle School, and Fountain-Fort Carson High School.
Ownership History
Date
Name
Owned For
Owner Type
Purchase Details
Closed on
Jul 1, 2020
Sold by
Orwig Nathan R
Bought by
Jacquez Richard Lee and Jacquez Nicole Danielle
Current Estimated Value
Home Financials for this Owner
Home Financials are based on the most recent Mortgage that was taken out on this home.
Original Mortgage
$310,276
Interest Rate
3%
Mortgage Type
FHA
Purchase Details
Closed on
Jul 23, 2015
Sold by
Garcia Elmer A and Garcia Adele S
Bought by
Orwig Nathan R
Home Financials for this Owner
Home Financials are based on the most recent Mortgage that was taken out on this home.
Original Mortgage
$234,945
Interest Rate
4.07%
Mortgage Type
VA
Purchase Details
Closed on
Apr 7, 1999
Sold by
Elite Properties Of America Inc
Bought by
Garcia Elmer A and Garcia Adele S
Home Financials for this Owner
Home Financials are based on the most recent Mortgage that was taken out on this home.
Original Mortgage
$81,000
Interest Rate
6.89%
Create a Home Valuation Report for This Property
The Home Valuation Report is an in-depth analysis detailing your home's value as well as a comparison with similar homes in the area
Home Values in the Area
Average Home Value in this Area
Purchase History
| Date | Buyer | Sale Price | Title Company |
|---|---|---|---|
| Jacquez Richard Lee | $316,000 | First American Title | |
| Orwig Nathan R | $230,000 | Fidelity National Title Ins | |
| Garcia Elmer A | $140,285 | Land Title |
Source: Public Records
Mortgage History
| Date | Status | Borrower | Loan Amount |
|---|---|---|---|
| Previous Owner | Jacquez Richard Lee | $310,276 | |
| Previous Owner | Orwig Nathan R | $234,945 | |
| Previous Owner | Garcia Elmer A | $81,000 |
Source: Public Records
Tax History Compared to Growth
Tax History
| Year | Tax Paid | Tax Assessment Tax Assessment Total Assessment is a certain percentage of the fair market value that is determined by local assessors to be the total taxable value of land and additions on the property. | Land | Improvement |
|---|---|---|---|---|
| 2025 | $1,522 | $27,740 | -- | -- |
| 2024 | $1,363 | $28,890 | $5,180 | $23,710 |
| 2022 | $1,286 | $22,040 | $3,580 | $18,460 |
| 2021 | $1,194 | $22,670 | $3,680 | $18,990 |
| 2020 | $961 | $17,850 | $3,220 | $14,630 |
| 2019 | $942 | $17,850 | $3,220 | $14,630 |
| 2018 | $883 | $16,160 | $2,340 | $13,820 |
| 2017 | $873 | $16,160 | $2,340 | $13,820 |
| 2016 | $831 | $15,370 | $2,390 | $12,980 |
| 2015 | $416 | $15,370 | $2,390 | $12,980 |
| 2014 | $389 | $14,440 | $2,390 | $12,050 |
Source: Public Records
Map
Nearby Homes
- 850 Barn Owl Dr
- 895 Rancher Dr Unit FOU
- 11383 Berry Farm Rd
- 11360 Berry Farm Rd
- 908 Candlestar Loop N
- 7865 Wilson Rd
- 843 Hayloft Ln
- 11288 Berry Farm Rd
- 7661 Barn Owl Dr
- 11585 Orleans Rd
- 11224 Berry Farm Rd
- 995 Square Dance Ln
- 277 Turf Trail Place
- 11426 Melden Way
- 11155 Falling Star Rd
- 10994 Tidal Run Cir
- 11081 Buckhead Place
- 11130 Feliz Way
- 20785 El Nino
- 10858 Traders Pkwy
- 833 Candlestar Loop N
- 825 Candlestar Loop N
- 837 Candlestar Loop N
- 1094 Clogger Ln
- 1093 Swayback Dr N
- 1094 Swayback Dr N
- 841 Candlestar Loop N
- 1090 Clogger Ln
- 1089 Swayback Dr N
- 845 Candlestar Loop N
- 834 Daffodil St
- 854 Candlestar Loop N Unit FOU
- 830 Daffodil St
- 838 Daffodil St
- 1090 Swayback Dr N
- 1085 Swayback Dr N
- 826 Daffodil St
- 1086 Clogger Ln
- 842 Daffodil St
- 849 Candlestar Loop N