Estimated Value: $181,000 - $188,000
3
Beds
3
Baths
1,663
Sq Ft
$111/Sq Ft
Est. Value
About This Home
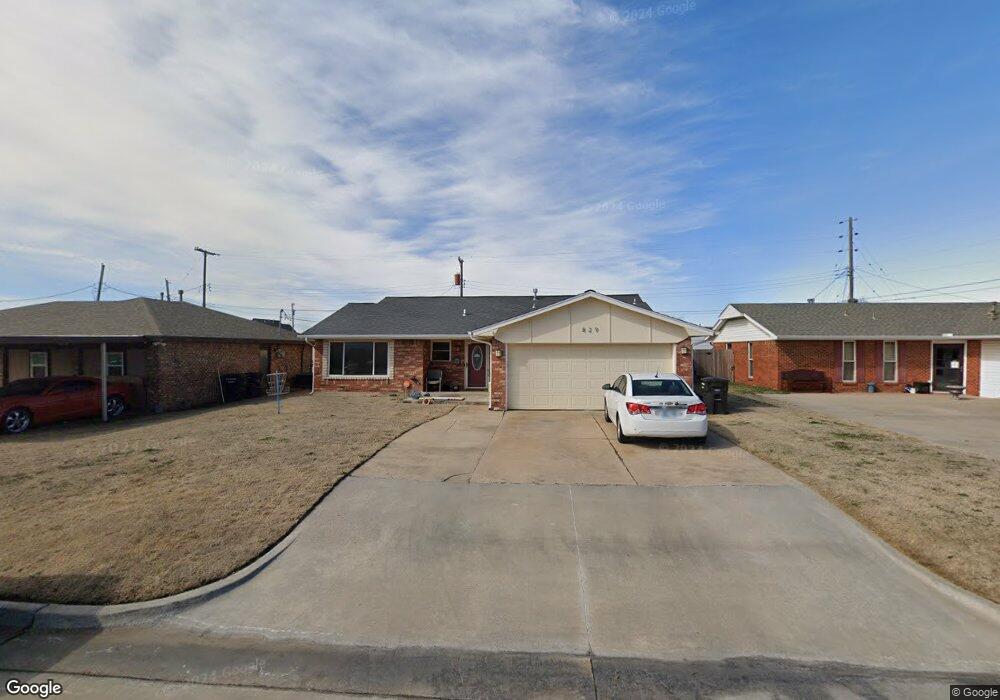
This home is located at 829 Cardan Place, Moore, OK 73160 and is currently estimated at $184,230, approximately $110 per square foot. 829 Cardan Place is a home located in Cleveland County with nearby schools including Plaza Towers Elementary School, Highland West Junior High School, and Southmoore High School.
Ownership History
Date
Name
Owned For
Owner Type
Purchase Details
Closed on
Oct 1, 2012
Sold by
Federal Home Loan Mortgage Corporation
Bought by
Johnson Scott
Current Estimated Value
Home Financials for this Owner
Home Financials are based on the most recent Mortgage that was taken out on this home.
Original Mortgage
$98,090
Outstanding Balance
$66,835
Interest Rate
3.55%
Mortgage Type
FHA
Estimated Equity
$117,395
Purchase Details
Closed on
Aug 21, 2012
Sold by
Degeare Corey E and Degeare Jennifer
Bought by
Federal Home Loan Mortgage Corporation
Home Financials for this Owner
Home Financials are based on the most recent Mortgage that was taken out on this home.
Original Mortgage
$98,090
Outstanding Balance
$66,835
Interest Rate
3.55%
Mortgage Type
FHA
Estimated Equity
$117,395
Purchase Details
Closed on
Aug 31, 2006
Sold by
Wilbur Kevin and Wilbur Wendy L
Bought by
Degearce Corey E
Home Financials for this Owner
Home Financials are based on the most recent Mortgage that was taken out on this home.
Original Mortgage
$92,000
Interest Rate
6.64%
Mortgage Type
New Conventional
Create a Home Valuation Report for This Property
The Home Valuation Report is an in-depth analysis detailing your home's value as well as a comparison with similar homes in the area
Home Values in the Area
Average Home Value in this Area
Purchase History
| Date | Buyer | Sale Price | Title Company |
|---|---|---|---|
| Johnson Scott | $100,000 | None Available | |
| Federal Home Loan Mortgage Corporation | -- | None Available | |
| Degearce Corey E | $92,000 | None Available |
Source: Public Records
Mortgage History
| Date | Status | Borrower | Loan Amount |
|---|---|---|---|
| Open | Johnson Scott | $98,090 | |
| Previous Owner | Degearce Corey E | $92,000 |
Source: Public Records
Tax History
| Year | Tax Paid | Tax Assessment Tax Assessment Total Assessment is a certain percentage of the fair market value that is determined by local assessors to be the total taxable value of land and additions on the property. | Land | Improvement |
|---|---|---|---|---|
| 2025 | $2,060 | $16,832 | $2,459 | $14,373 |
| 2023 | $1,861 | $15,267 | $2,487 | $12,780 |
| 2022 | $1,799 | $14,541 | $2,557 | $11,984 |
| 2021 | $1,721 | $13,848 | $2,160 | $11,688 |
| 2020 | $1,722 | $13,848 | $2,160 | $11,688 |
| 2019 | $1,752 | $13,848 | $2,160 | $11,688 |
| 2018 | $1,753 | $13,849 | $2,160 | $11,689 |
| 2017 | $1,762 | $13,849 | $0 | $0 |
| 2016 | $1,775 | $13,849 | $2,160 | $11,689 |
| 2015 | $1,734 | $14,951 | $2,100 | $12,851 |
| 2014 | $1,691 | $14,239 | $1,020 | $13,219 |
Source: Public Records
Map
Nearby Homes
- 829 SW 8th St
- 849 SW 10th St
- 712 Penn Ln
- 690 SW 12th St
- 779 SW 14th St
- 13908 Broadway Ave
- 947 SW 4th Place
- 925 SW 14th St
- 753 SW 4th Place
- 1301 Heather Ln
- 764 SW 3rd St
- 936 SW 2nd St
- 13801 Robinson Ct
- 1049 SW 3rd St
- 1025 SW 16th St
- 125 S Dillon Ave
- 753 SW 1st St
- 16 SW 132nd St
- 209 S Irving Dr
- 819 NW 1st St
- 825 Cardan Place
- 833 Cardan Place
- 824 SW 8th St
- 837 Cardan Place
- 836 Fleming Cir
- 822 Cardan Place
- 824 Cardan Place
- 840 Fleming Cir
- 826 Cardan Place
- 828 SW 8th St
- 839 Cardan Place
- 820 Cardan Place
- 828 Cardan Place
- 843 Cardan Place
- 830 Cardan Place
- 844 Fleming Cir
- 845 Cardan Place
- 833 SW 8th St
- 837 SW 8th St
- 841 SW 8th St
Your Personal Tour Guide
Ask me questions while you tour the home.